Upload date
All time
Last hour
Today
This week
This month
This year
Type
All
Video
Channel
Playlist
Movie
Duration
Short (< 4 minutes)
Medium (4-20 minutes)
Long (> 20 minutes)
Sort by
Relevance
Rating
View count
Features
HD
Subtitles/CC
Creative Commons
3D
Live
4K
360°
VR180
HDR
167,787 results
cumulative relative frequency
dot plot
box plot
relative frequency distribution
histogram frequency density
relative frequency probability
grouped frequency distribution
frequency polygon
class boundaries frequency
frequency curve
frequency distribution table
cumulative frequency distribution
sample mean
bar chart
histogram statistics math ap giffhorn relative cumulative.
159,482 views
10 years ago
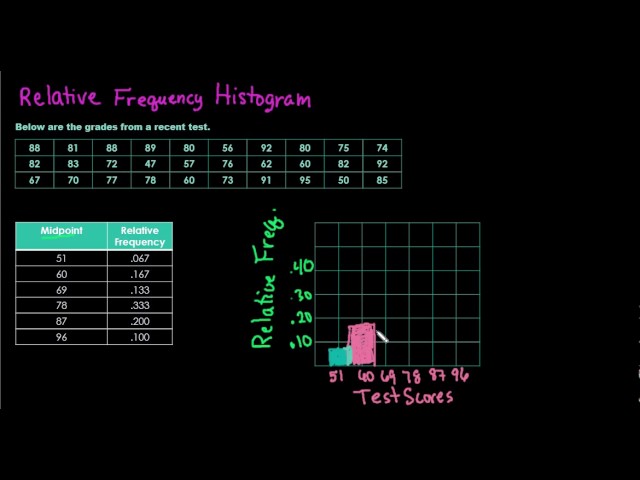
Learn how to create a relative frequency histogram.
17,740 views
8 years ago
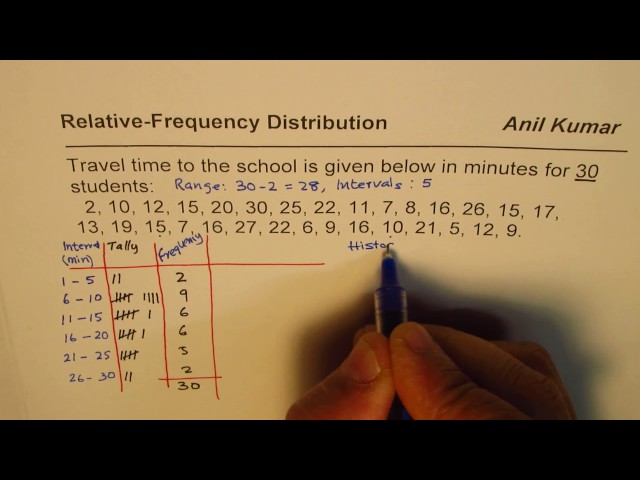
Relative frequency is how often something happens divided by all the possible outcomes. To learn more visit us at ...
2,099 views
1 year ago
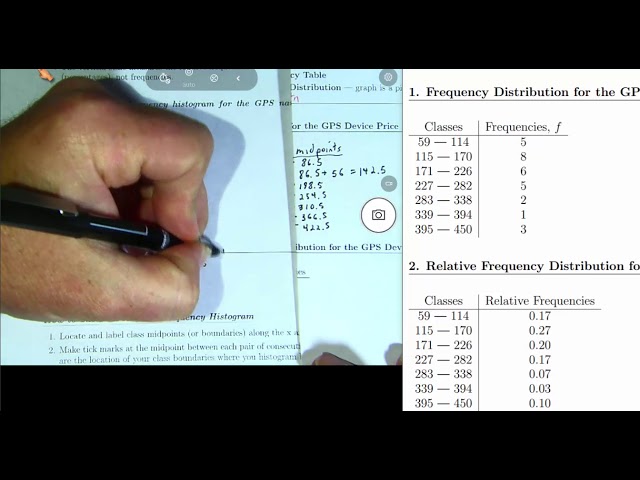
This statistics video tutorial explains how to make a histogram using a frequency distribution table. Statistics - Free Formula Sheet: ...
788,112 views
6 years ago
This video will show the step by step method in constructing a relative frequency histogram. This is the link of the applet used in ...
4,820 views
5 years ago
11,768 views
In this video we're going to discuss how to construct a relative frequency histogram so in the previous video we did the exact same ...
10,287 views
9 years ago
Visit http://ilectureonline.com for more math and science lectures! We will learn what is and how data is represented in a ...
7,628 views
https://StudyForce.com ✓ https://Biology-Forums.com ✓ Ask questions here: https://Biology-Forums.com/index.php?... Follow us: ...
722 views
7 years ago
How to create a relative frequency histogram using basic Excel functions.
11,593 views
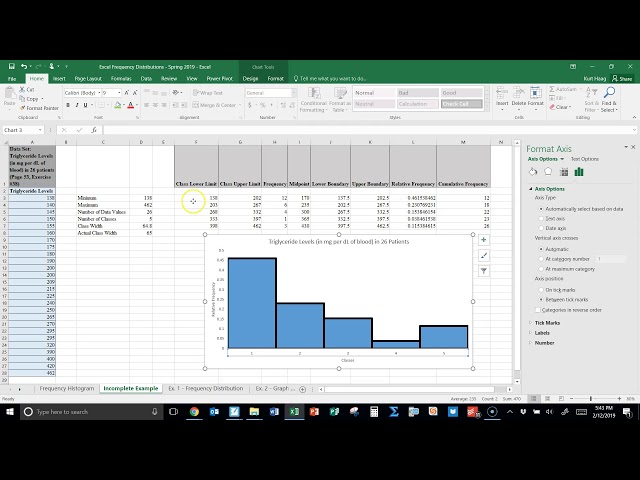
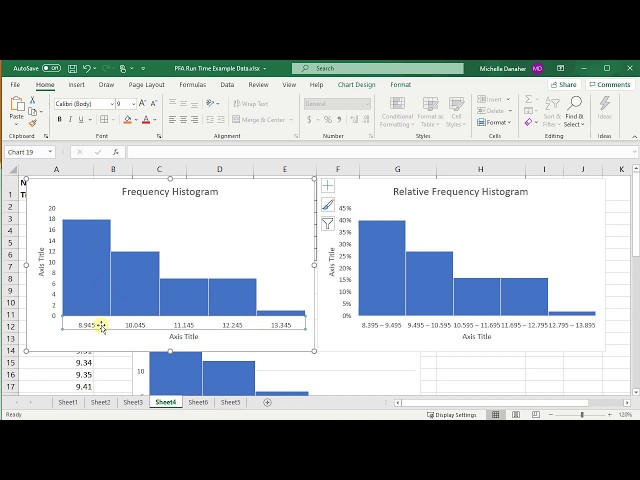
In this video I discuss how to construct Frequency Histograms, Relative Frequency Histograms and Ogives in Excel.
2,882 views
Cylurian step-by-STEP is online - http://cylurian.com A histogram is related to a bar graph and is meant for quantitative data ...
336,983 views
12 years ago
Using Excel to draw a frequency histogram using a bar chart with 0-gap width.
13,987 views
4 years ago
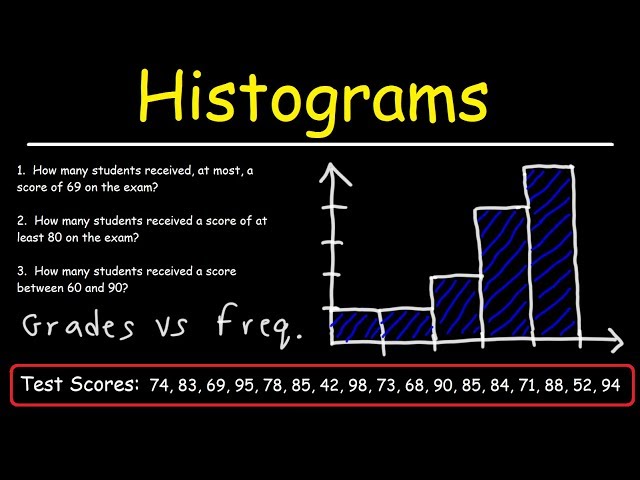
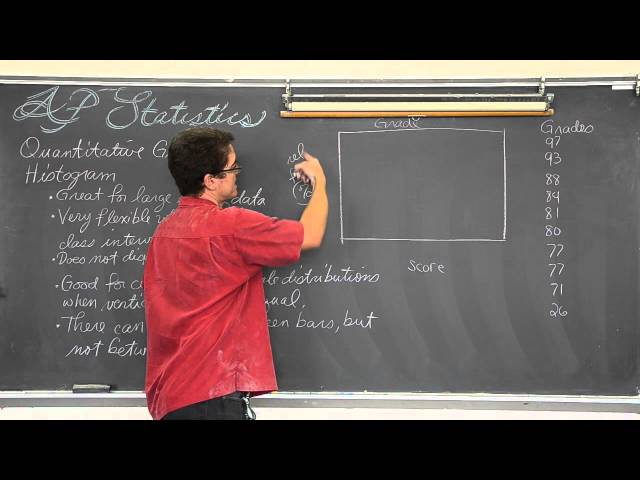
Introducing the uses of histograms in statistics, how to construct them and interpret them. Check out http://www.ProfRobBob.com ...
94,026 views
14 years ago
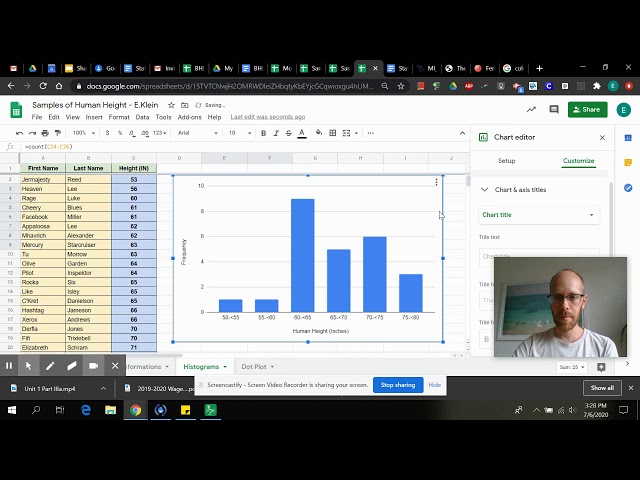
How to make a histogram in Google Sheets from a grouped frequency distribution. We will also plot a frequency polygon and ...
7,667 views
2 years ago
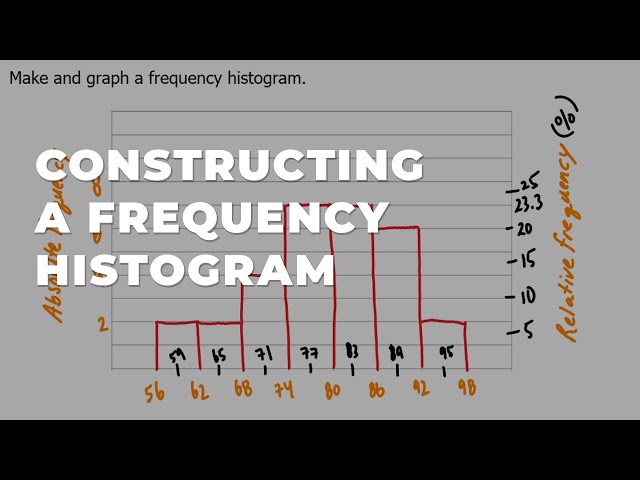
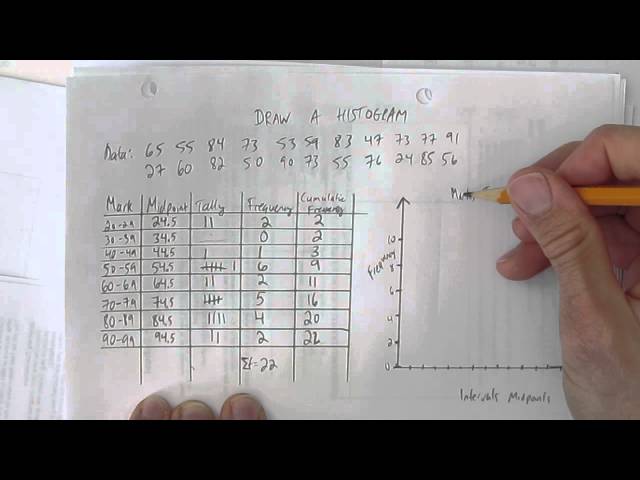
... MAIN RELEVANCE: MDM4U This video shows how to draw a frequency histogram given data in intervals.
13,394 views
11 years ago
Histogram of Unequal width and Frequency Density concept: ...
6,733 views
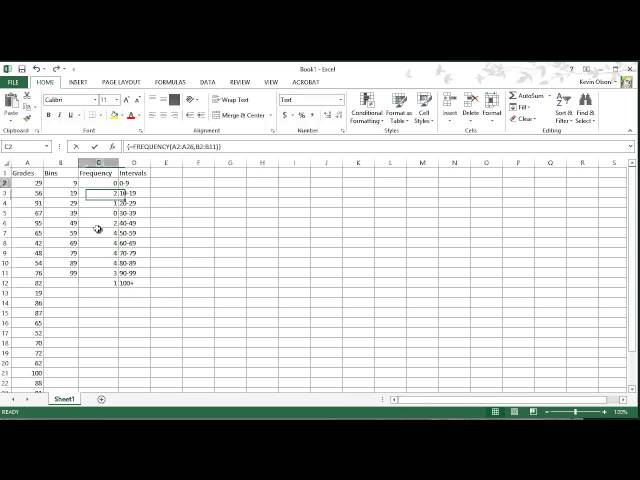
Goal: Use the frequency function to determine the classes of a data set and create a histogram based on the frequency data.
668,062 views
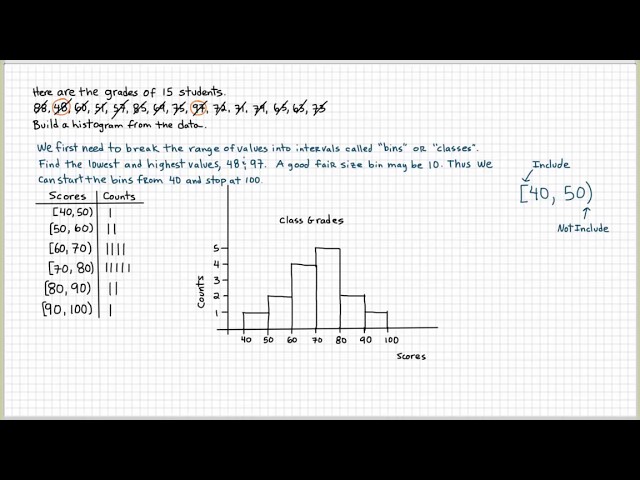
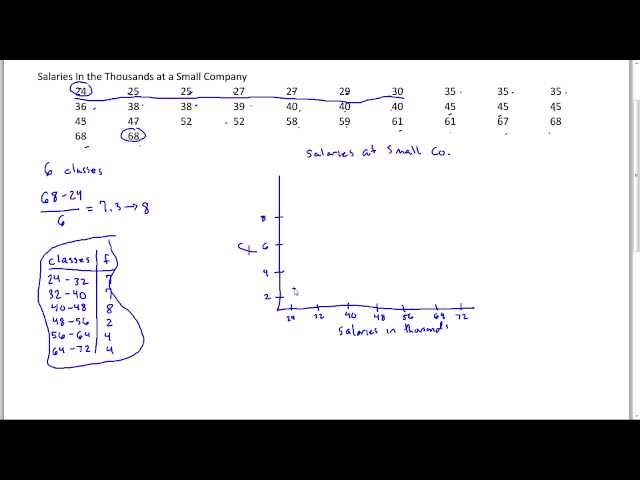
Using a small data set, in this video I show you how to make a frequency distribution and the corresponding histogram by hand.
109,104 views
This statistics video tutorial explains how to make a relative frequency distribution table. Statistics - Free Formula Sheet: ...
602,270 views
Make a Relative Frequency Histogram using Excel.
84,424 views
done in Excel.
48,104 views
835 views
This project was created with Explain Everything™ Interactive Whiteboard for iPad.
276 views
3 years ago
In this video we discuss what is a histogram, and how to construct make a histogram graph from a frequency distribution table in ...
274,305 views
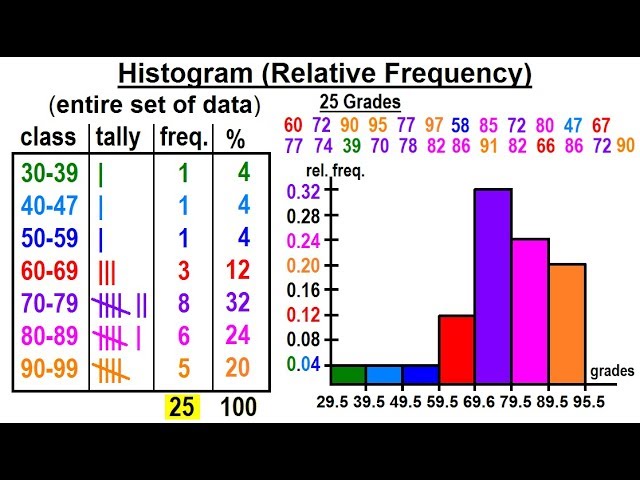
A relative frequency histogram is the graph of a relative frequency distribution table.
623 views
How to interpret relative frequency histograms.
8,841 views
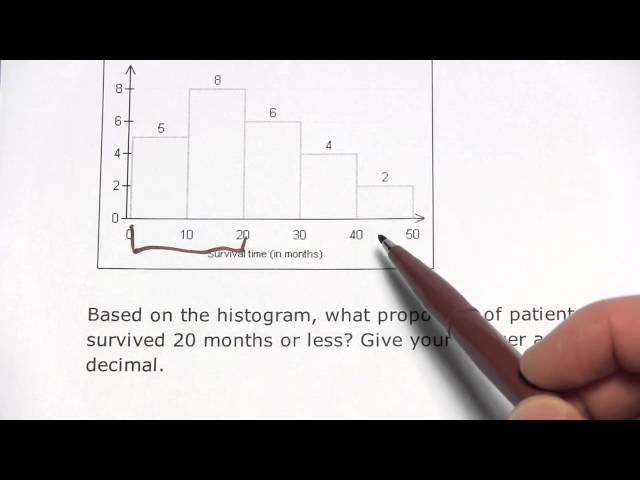
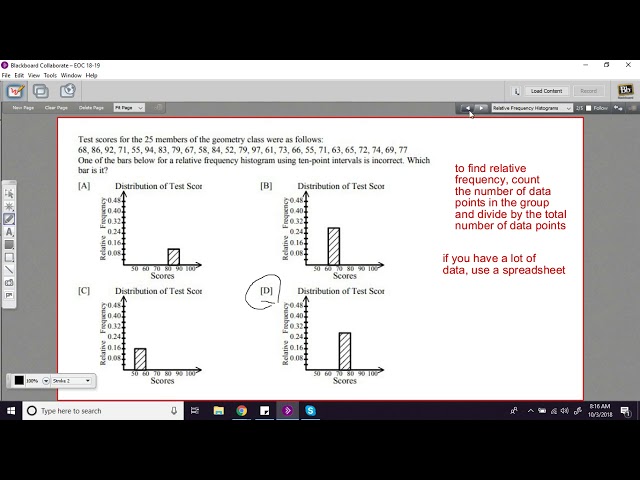
How to solve problems involving relative frequency histograms.
1,024 views
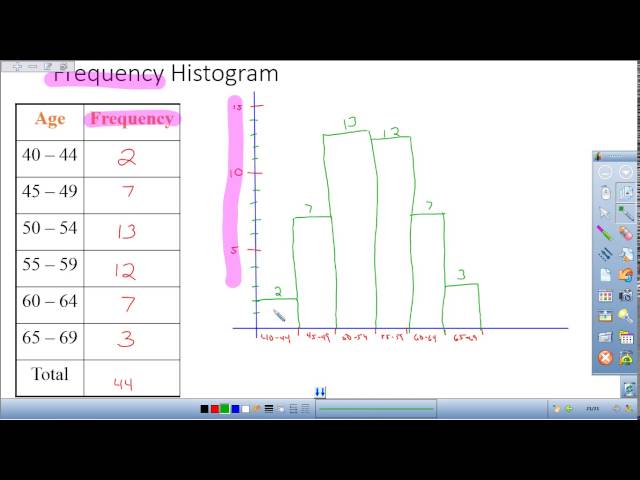
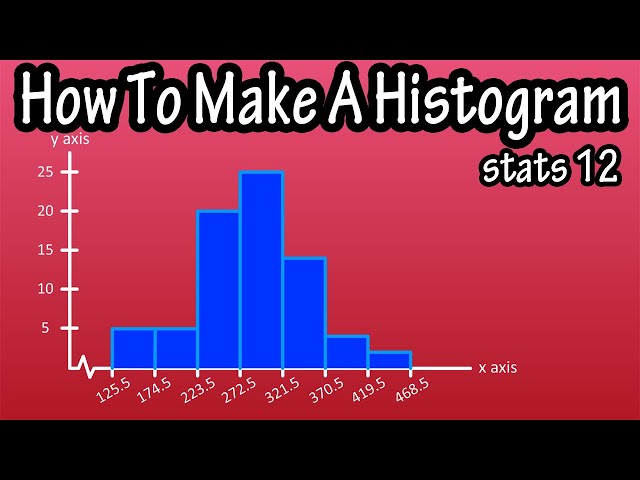
This video is a how to create a frequency or relative frequency histogram by hand. For more math shorts go to www.
75,241 views