Upload date
All time
Last hour
Today
This week
This month
This year
Type
All
Video
Channel
Playlist
Movie
Duration
Short (< 4 minutes)
Medium (4-20 minutes)
Long (> 20 minutes)
Sort by
Relevance
Rating
View count
Features
HD
Subtitles/CC
Creative Commons
3D
Live
4K
360°
VR180
HDR
75,223 results
python plotly dash
python bokeh
plotly express
Unlock the full potential of Python for data visualization in just 1.5 hours with this comprehensive Plotly tutorial. Perfect for ...
9,684 views
2 years ago
Colab Notebook: https://colab.research.google.com/drive/1wxI23X7EzV2-DlWU7F0iIeTSTV2OPYTy?usp=sharing Thank you for ...
35,422 views
3 years ago
Tired of Matplotlib's outdated approach? Discover these 5 powerful Python libraries that offer cleaner, more intuitive, and often ...
7,024 views
1 year ago
In this video Rob, a Kaggle Grandmaster, quickly and humorously walks through each of the popular plotting and data ...
106,440 views
In this video, you'll learn how to build a simple and interactive dashboard using Python and the Dash framework. Dash is a ...
748,082 views
Start learning to code for FREE — and get 20% OFF Scrimba Pro: ...
2,430,805 views
5 months ago
Tired of manipulating Excel dashboards with complex VBA macros? In this tutorial, you'll discover a comprehensive workflow I use ...
153,124 views
What is descriptive analytics? Descriptive analytics is a type of data analytics that looks at past data to give an account of what has ...
124,589 views
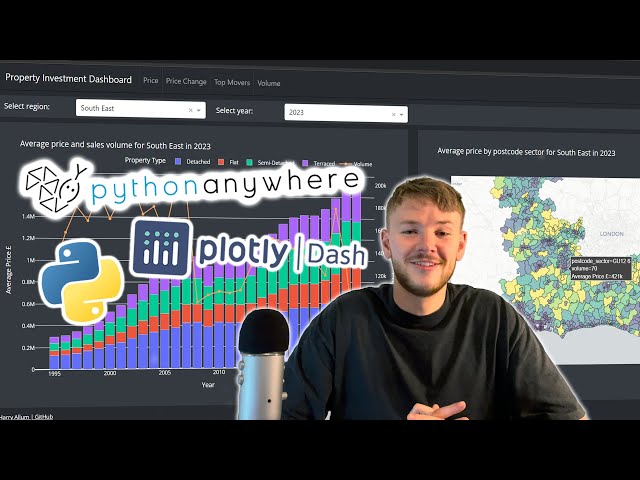
My Dashboard: https://www.thepropertydashboard.co.uk/ Project GitHub: https://github.com/harryallum/Dash-Property-Dashboard ...
26,335 views
UPDATE: The layout of Figma has slightly changed after recording this video. The create new design file button is at the top ...
151,701 views
Join my Python Masterclass - https://www.zerotoknowing.com/join-now Join my Python Newsletter ...
9,554 views
Get your Free Python Starter Course ~ https://tinyurl.com/2kjh4n4r Join 9k+ Readers — Python Newsletter ...
22,229 views
Playlist: https://www.youtube.com/playlist?list=PLNmsVeXQZj7pb4apqIMKvCz37t_dLznMm ❤❤❤ Early access to tutorials, polls, live ...
19,728 views
4 years ago
We create a real time trading dashboard using Plotly Dash. We retrieve OHLC data from Bitstamp and plot out our indicators in ...
31,256 views
Explore All My Excel Solutions: https://pythonandvba.com/solutions DESCRIPTION ...
8,740 views
New Data Science / Machine Learning Video Everyday at 1 PM EST!!! [ Click Notification Bell ] This video provides complete ...
261,219 views
5 years ago
In this video we take a quick look at the Plotly framework in Python. At the end we compare it to Matplotlib.
104,518 views
An introduction to the Dash web application framework. Dash is used to create browser-based interactive data visualization ...
852,068 views
Data visualization is an important part of working with data and Python has many libraries that allow you to display a wide range of ...
11,353 views
Data visualization is an import part of working with data and Python has many libraries that allow you to display a wide range of ...
7,958 views
11,974 views
5,385 views
Matplotlib vs Seaborn vs Plotly: Best Python Visualization Tools.
2,145 views
1 month ago
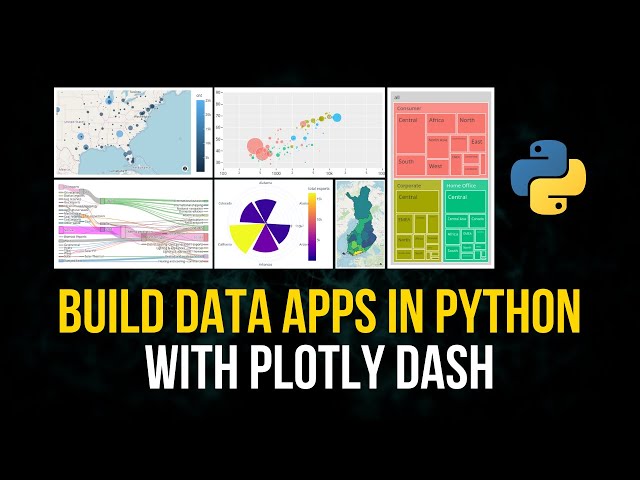
In this video, we learn how to easily build data applications in Python with Plotly Dash. Dash Examples: ...
17,878 views


![📈 How To Create A Candlestick Chart In Python Using Plotly | Tutorial [EASY]](/api/proxy/image?url=https%3A%2F%2Fi.ytimg.com%2Fvi%2Fc1zwV8x-zK4%2Fsddefault.jpg)
![How To Create A Waterfall Chart In Python Using Plotly & Excel | Tutorial [EASY] 💻](/api/proxy/image?url=https%3A%2F%2Fi.ytimg.com%2Fvi%2FTQWwaLqtpq4%2Fsddefault.jpg)