Upload date
All time
Last hour
Today
This week
This month
This year
Type
All
Video
Channel
Playlist
Movie
Duration
Short (< 4 minutes)
Medium (4-20 minutes)
Long (> 20 minutes)
Sort by
Relevance
Rating
View count
Features
HD
Subtitles/CC
Creative Commons
3D
Live
4K
360°
VR180
HDR
3,519 results
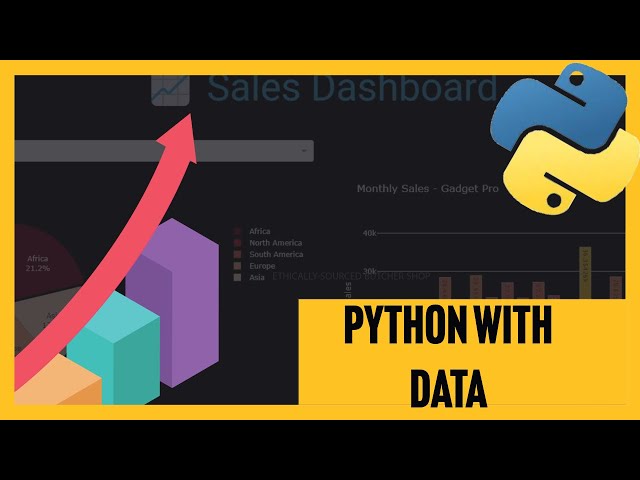
Unleash the power of data with our quick rundown of the "Top 3 Python Libraries for Stunning Data Visuals!" ✨ In this video, we ...
608 views
6 months ago
In this video for Day 808, we show you how to create interactive plots using Plotly directly from a pandas DataFrame. You'll learn ...
3,017 views
4 months ago
In this new walkthrough, we explore how to use the blazing-fast Polars dataframe library in a Dash app, featuring a dynamic Excel ...
225 views
3 weeks ago
In this video, I cover the top 2 Python libraries for data visualisation: Matplotlib and Plotly. Matplotlib is the most well-known and ...
728 views
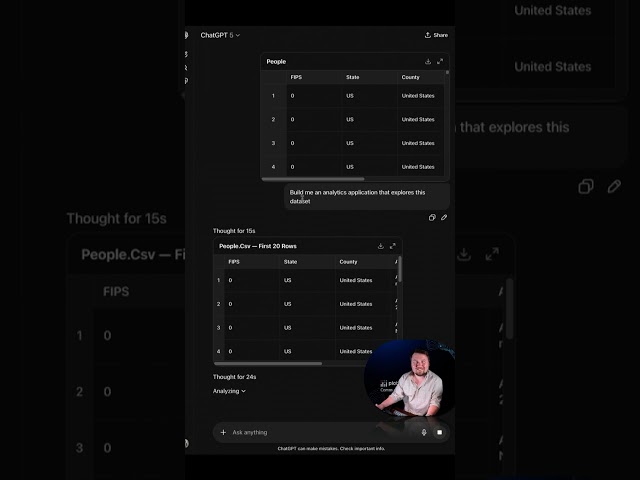
Can general-purpose AI like OpenAI's ChatGPT build better Dash apps than Plotly Studio? We put them head-to-head: • Dropped ...
1,551 views
2 months ago
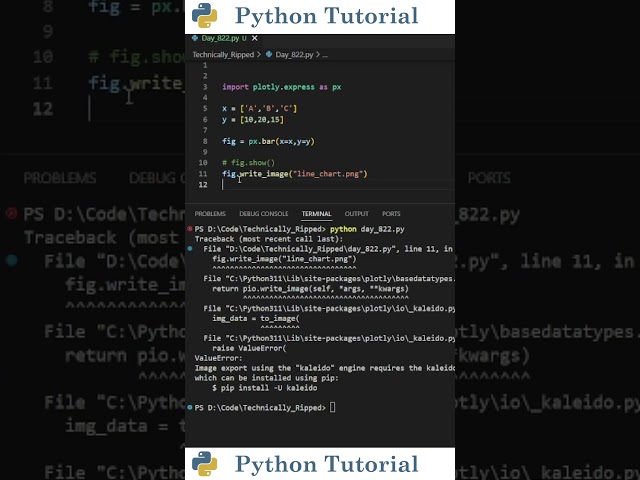
Learn two easy ways to save your Plotly charts as image files in Python! Use write_image() with the Kaleido library, or take a ...
5,796 views
3 months ago
Get started with DataCamp and their Finance with Python track today! https://datacamp.pxf.io/RGZMVb In this video, I'll show you ...
110,639 views
7 months ago
Watch as I compare plotting the same line chart in Matplotlib and Plotly. One gives you a clean, static image while the other offers ...
1,328 views
Learn how to design great software in 7 steps: https://arjan.codes/designguide. Check out my courses: ...
35,496 views
8 months ago
Mastering Interactive Data Visualization with Plotly in Python | Build Stunning Charts for Business Dashboards Want to turn ...
171 views
Explore All My Excel Solutions: https://pythonandvba.com/solutions DESCRIPTION ...
2,844 views
11 months ago
Matplotlib vs Seaborn vs Plotly: Best Python Visualization Tools.
2,144 views
1 month ago
Build a stunning Python dashboard with real-time charts and full SQL integration! In this video, I'll show you how to create ...
650 views
Try CodeCrafters for free using my referral link: https://app.codecrafters.io/join?via=trentpark8800 Welcome to this ...
13,234 views
Learn how to animate your data visualizations using Plotly Express. This tutorial shows you how to use animation_frame to create ...
1,430 views
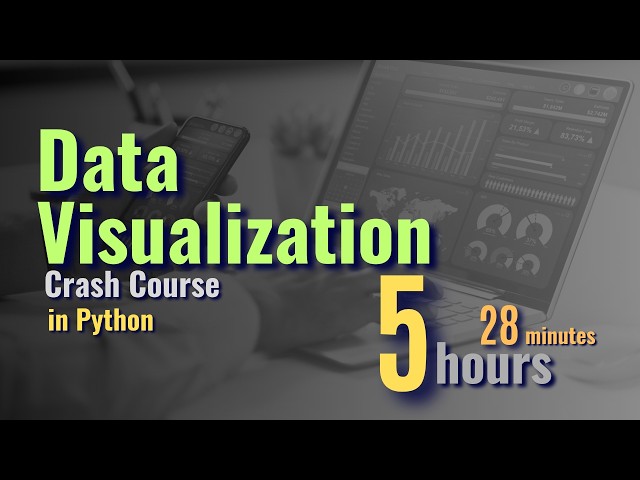
Video Description: Master Data Visualization with Python: From Beginner to Advanced! In this comprehensive Data ...
33,193 views
In this tutorial, you'll learn how to add a moving average line to your Plotly line charts using Python. This is perfect for analyzing ...
1,380 views
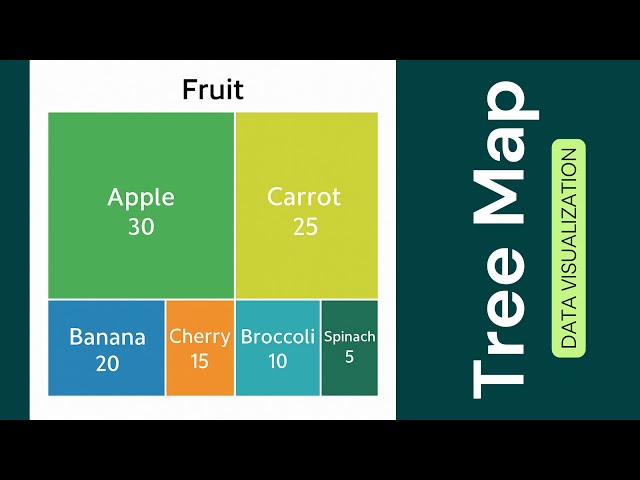
Plotly #TreeMap #DataVisualization #Python #Tutorial Welcome to our Data Visualization with Plotly series! In this tutorial, we'll ...
85 views
5 months ago
How To Install Plotly For Python In VS Code Plotly is a powerful graphing library that helps Python users create interactive ...
277 views
Learn how to create candlestick charts using Plotly in Python! This tutorial covers the basics of plotting daily stock data (Open, ...
1,792 views