Upload date
All time
Last hour
Today
This week
This month
This year
Type
All
Video
Channel
Playlist
Movie
Duration
Short (< 4 minutes)
Medium (4-20 minutes)
Long (> 20 minutes)
Sort by
Relevance
Rating
View count
Features
HD
Subtitles/CC
Creative Commons
3D
Live
4K
360°
VR180
HDR
86 results
Hello Everyone! Today, in this video, I am going to step-by-step guide you on How to install Plotly with the latest Python on ...
73 views
3 days ago
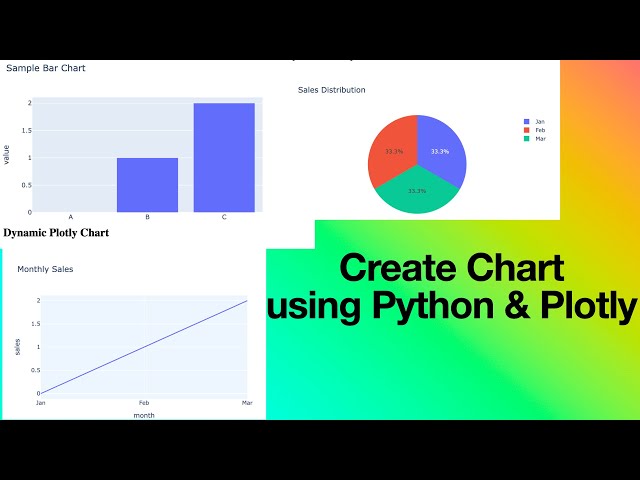
Learn how to generate dynamic Plotly charts in Python and export them as JSON for dashboards, web apps, and data ...
6 views
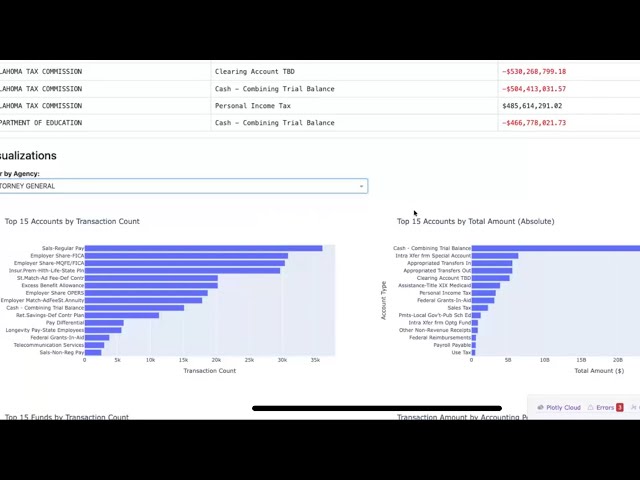
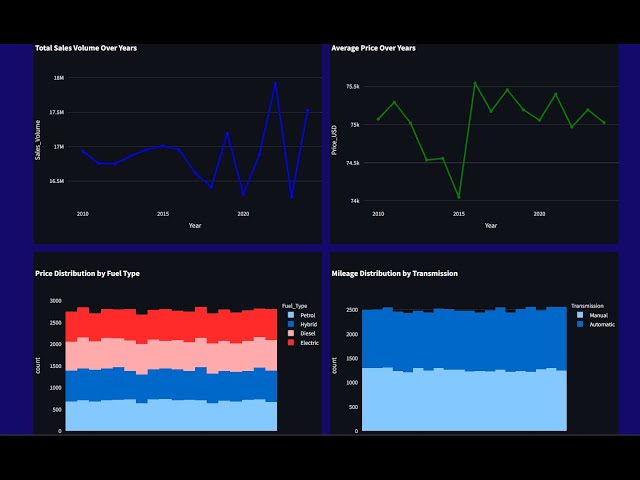
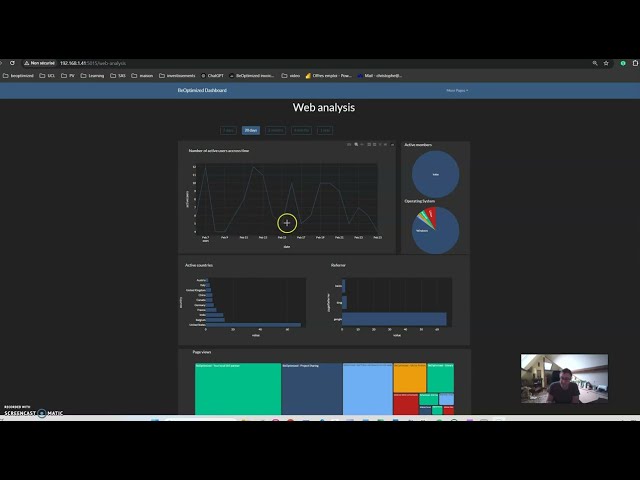
Watch me build a complete financial analysis dashboard from scratch with AI assistance! In this live coding session, I work with ...
330 views
5 days ago
Day 49: Python MATPLOTLIB Plots - Stacked Histogram, Bar, Pie, Subplot Plot | Visualization Library | Step by Step Examples ...
55 views
6 days ago
This tutorial will guide you through how to use LightGBM in Python to build super-fast and accurate machine learning models from ...
217 views
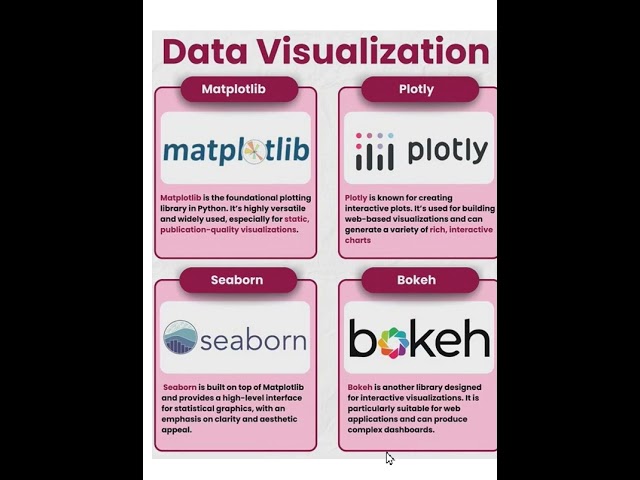
Data Visualization #Matplotlib #plotly #Seaborn #coding Bokeh #coding #python #interviewprep ...
8 views
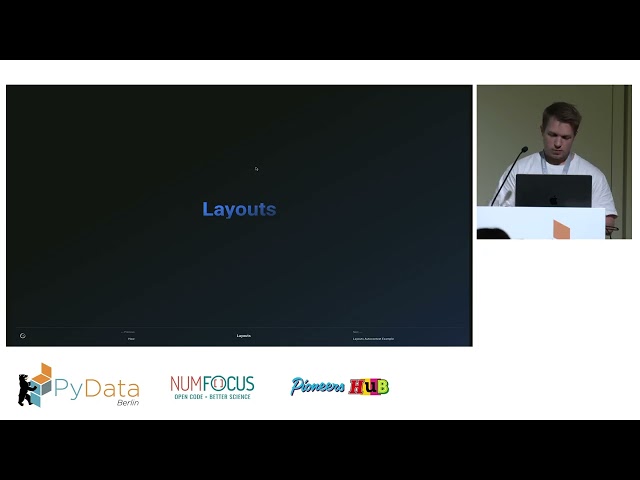
Recorded at PyData Berlin 2025, https://2025.pycon.de/program/VURY38/ Build interactive web apps entirely in Python without ...
0 views
10 hours ago
Are you looking for a new mission? As a freelancer, it's not always easy to read the market and identify new companies to target.
4 days ago
DataScience #Python #Streamlit #Plotly #Dashboard #DataVisualization hashtag#BusinessIntelligence #BMW #Analytics ...
Bar Plot Easy Explanation in a Minute | Visualization Library | Step by Step Examples | Complete AI Journey | Complete Python ...
Visualisation Libraries in Python Explained | Learn Data Analysis | Join CodeSquadz & Get an IT Job Python is one of the most ...
304 views
Subplot Easy Explanation in a Minute | Visualization Library | Step by Step Examples | Complete AI Journey | Complete Python ...
74 views
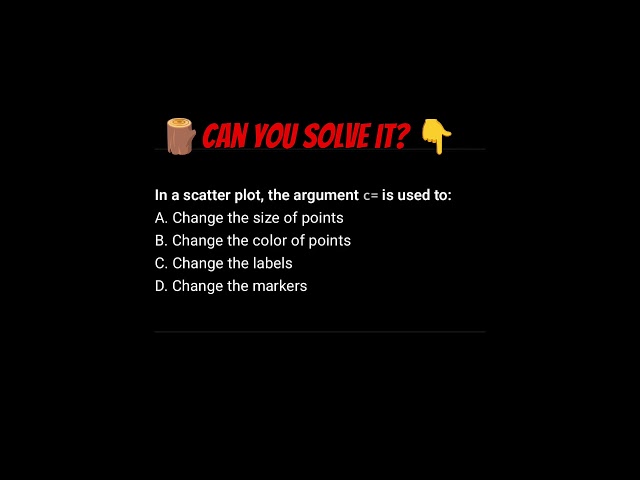
python daily interview quizes | Are you ready to solve it | Khushboo Garg #Python #PythonProgramming #PythonTutorial ...
135 views
Pie Plot Easy Explanation in a Minute | Visualization Library | Step by Step Examples | Complete AI Journey | Complete Python ...
NumPy itself does not create graphs, but it is the foundation for data visualization in Python. Visualization libraries like Matplotlib, ...
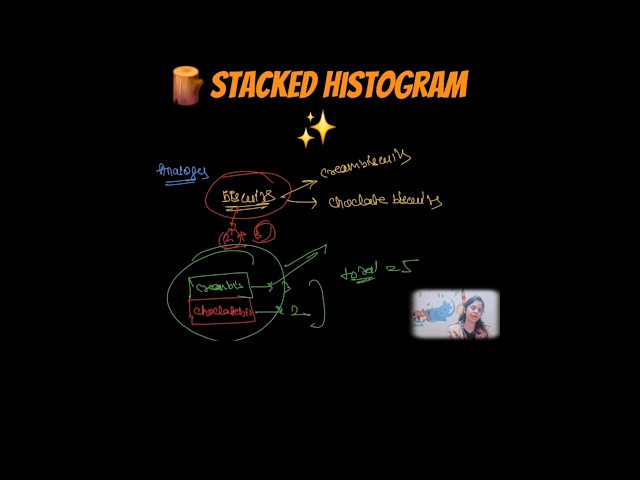
Stacked Histogram Plot Easy Explanation in a Minute | Visualization Library | Step by Step Examples | Complete AI Journey ...
Here you will learn the new-edge technologies like Data Science, Machine Learning, SQL, Python, Power BI, Tableau, and other ...
1,405 views
Google Analytics is an excellent tool for monitoring your website's traffic. In this video, I explain how I access Google Analytics ...
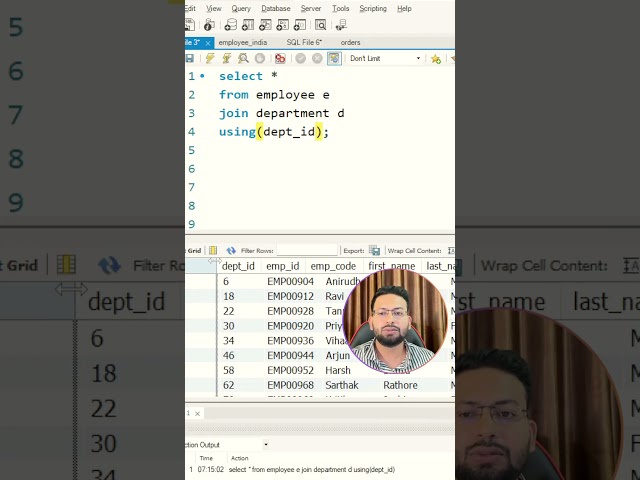
In this SQL short, we learn how to find all employees who don't have a manager and display their department name too. This is a ...
11 hours ago
![How to Install Plotly with latest Python on Windows 10/11 [ 2025 Update ] Plotly Tutorial](/api/proxy/image?url=https%3A%2F%2Fi.ytimg.com%2Fvi%2FSmoaSXEZgYA%2Fsddefault.jpg)