Upload date
All time
Last hour
Today
This week
This month
This year
Type
All
Video
Channel
Playlist
Movie
Duration
Short (< 4 minutes)
Medium (4-20 minutes)
Long (> 20 minutes)
Sort by
Relevance
Rating
View count
Features
HD
Subtitles/CC
Creative Commons
3D
Live
4K
360°
VR180
HDR
814,098 results
histogram frequency density
histogram excel
histogram relative frequency
histograma excel
histogram statistics
excel histogram data analysis
how to create histogram in word
frequency polygon
cumulative frequency igcse maths
In this video tutorial we're going to have a look at how to make a histogram in Excel, which is one of the ways to create a clear ...
897,830 views
3 years ago
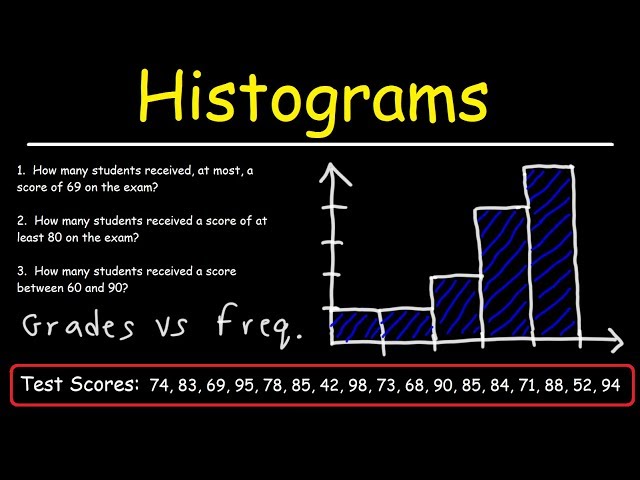
This statistics video tutorial explains how to make a histogram using a frequency distribution table. Statistics - Free Formula Sheet: ...
775,646 views
6 years ago
Join my newsletter https://steven-bradburn.beehiiv.com/subscribe In this video tutorial, I will show you how to create a frequency ...
558,070 views
5 years ago
This example shows how to make a histogram. Remember that the horizontal axis represents the values of the variables.
1,234,270 views
14 years ago
Join 400000+ professionals in our courses here https://link.xelplus.com/yt-d-all-courses An Excel histogram chart is very easy ...
520,972 views
This video is for students aged 14+ studying GCSE Maths. A video explaining how to draw a histogram from a grouped frequency ...
155,887 views
2 years ago
In this video we discuss what is a histogram, and how to construct make a histogram graph from a frequency distribution table in ...
263,823 views
All right so I am here to create a histogram bins and frequency using Excel what I'm going to do first is um into my scores from a ...
80,213 views
How to generate a histogram using both Excel's built in 'Statistical Chart' and using a pivot table. The Excel solution is posted ...
23,630 views
1 year ago
In this video, I'll show you how to make a histogram in Microsoft Excel. A histogram is a graph/chart that shows the frequency ...
11,150 views
Creating Histogram from Data set (Not Frequency Table) Using Data Analysis ToolPack MS Excel (Office 365)
141,121 views
7 years ago
Creating a histogram using Microsoft Excel on Mac (Recorded with https://screencast-o-matic.com)
22,685 views
Demonstrating Excel 2016's Histogram chart tool, since it was not available on the classroom computers during lecture.
874,877 views
9 years ago
This video uses example data to walk through the steps of creating a histogram using Excel 2013 and using it to analyze shape, ...
147,560 views
8 years ago
DMAIC Roadmap step by step and common Tools to be used for each step https://youtu.be/1JbDR8F4U34 001 A summary of ...
92,421 views
4 years ago
Create a histogram in Excel from raw data and from a grouped frequency distribution. Learn how to turn raw data into a histogram ...
4,861 views
Excel Histogram with Normal Distribution Curve In this video, we will explain how you can create a histogram with a normal ...
266,717 views
In this quick Microsoft Excel tutorial video, learn how to make a histogram in Excel from your data. Learn how to select the data for ...
48,142 views
Courses on Khan Academy are always 100% free. Start practicing—and saving your progress—now: ...
1,291,180 views
10 years ago
In this video, I will show you how to create a histogram from a frequency table. Histograms are graphical representations of data ...
122,370 views
how to create Histogram in Excel with easy steps! #histogram #excel #how.
497,689 views
This tutorial is about How to plot #histogram of any data i #Origin? How to get mean value of particle size in OriginPro? How to ...
99,252 views
I walk you through how to create a histogram for a set of data.
365,557 views
13 years ago
Learn Introduction to Statistics for FREE: http://helpyourmath.com/150.5/mat150 Visit our GoFundMe: ...
397,012 views
Learn how to use a histogram to distribute something on a scale + modify bin sizes / intervals. Explained so everyone can ...
14,810 views
In this video we show you how to use Tableau to create bins and a histogram. Histograms help you see the distribution of records ...
83,975 views
In this video, I will show you three ways to create a histogram chart in Excel. The following three methods are covered: -- Using ...
136,095 views
My Courses on Linkedin Learning: https://www.linkedin.com/learning/instructors/tim-ngwena Histograms help show distribution.
17,929 views
Hello in this video I'm going to show you how to use Excel to produce the frequency distribution and the histogram we can ...
1,770,272 views
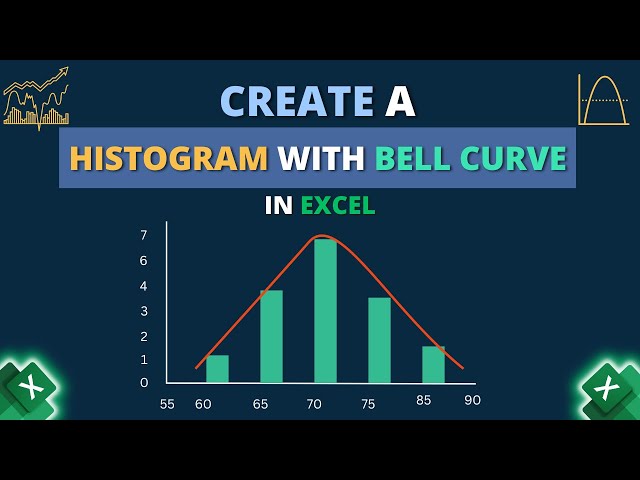
In this video, I'll guide you through two methods to create a histogram with a bell curve in Excel. You'll learn about histograms with ...
29,026 views


![How to make a histogram chart in Excel [in 3 easy steps]](/api/proxy/image?url=https%3A%2F%2Fi.ytimg.com%2Fvi%2F3y9USFtgrCY%2Fsddefault.jpg)