Upload date
All time
Last hour
Today
This week
This month
This year
Type
All
Video
Channel
Playlist
Movie
Duration
Short (< 4 minutes)
Medium (4-20 minutes)
Long (> 20 minutes)
Sort by
Relevance
Rating
View count
Features
HD
Subtitles/CC
Creative Commons
3D
Live
4K
360°
VR180
HDR
164,704 results
excel frequency function
histograma excel
relative frequency excel
frequency distribution excel
relative frequency histogram
excel histogram data analysis
boxplot excel
excel histogram interval
excel bar chart
how to create histogram
Join my newsletter https://steven-bradburn.beehiiv.com/subscribe In this video tutorial, I will show you how to create a frequency ...
558,976 views
5 years ago
You can use Microsoft Excel FREQUENCY Function to determine the frequency of a sata set, and create histograms, or a column ...
1,512 views
10 years ago
In this video tutorial we're going to have a look at how to make a histogram in Excel, which is one of the ways to create a clear ...
900,865 views
3 years ago
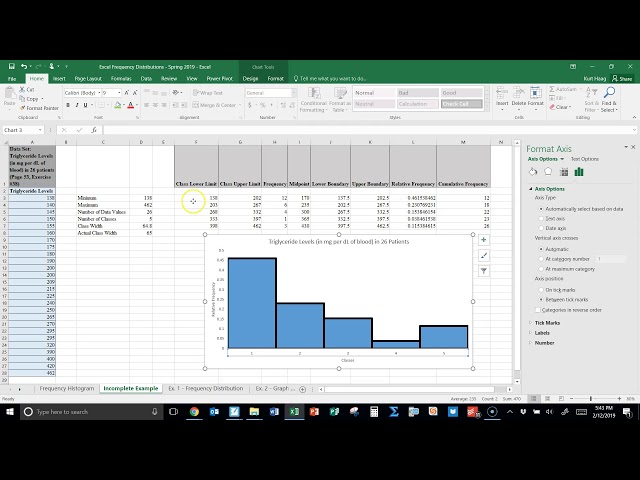
Hello in this video I'm going to show you how to use Excel to produce the frequency distribution and the histogram we can ...
1,771,086 views
9 years ago
Excel Histogram with Normal Distribution Curve In this video, we will explain how you can create a histogram with a normal ...
267,319 views
4 years ago
Microsoft Excel has a bevy of powerful chart-making tools, capable of creating almost any kind of graph or chart that one can ...
6,607 views
10 months ago
Today we are going to investigate how to build histograms in Excel using the FREQUENCY function and visualise data.
2,567 views
Download working file here: http://tinyurl.com/pkgj4yl This short video demonstrates how to create a Frequency Distribution table ...
82,505 views
11 years ago
If you have found this content useful and want to show your appreciation, please use this link to buy me a beer ...
34,003 views
frequency #excelfunctions -------------------------------------------------------------------- Visit the website for more content: ...
1,206 views
1 year ago
This video describes how to create a histogram in Excel with two or more data sets. The built-in Excel histogram only allows for a ...
18,086 views
11,654 views
6 years ago
This video shows you how to quickly create a Histogram in Excel.
10,344 views
2 years ago
One method for making data more comprehensible is to put it in a frequency distribution table. A frequency distribution describes ...
469 views
In this tutorial, I show how to make a histogram in Excel. You can easily insert a histogram chart into your spreadsheet with these ...
42,232 views
Join 400000+ professionals in our courses here https://link.xelplus.com/yt-d-all-courses An Excel histogram chart is very easy ...
521,494 views
Module III: This video shows how to use excel to create Histogram of a Grouped Frequency Table.
50,998 views
This tutorial demonstrates how to create a frequency distribution and a histogram of student grades using Bin numbers. This is ...
38,771 views
8 years ago
Find the frequency of two different data set using the Frequency Function, and then put that data into a histogram.
123,951 views
7 years ago
Create a frequency distribution table and histogram using the Data Analysis feature in Excel.
3,773 views
This video demonstrates how to graph a frequency distribution using the “Histogram” feature in Microsoft Excel.
497 views
We create a frequency table and graph in Excel using the FREQUENCY function. In our example, we have the heights of a sample ...
1,567 views
Short video of how to use the Frequency function in Excel to build an updatable frequency distribution for a histogram.
7,139 views
Make a Frequency Polygon in Excel using midpoints and frequencies from the grouped frequency distribution. Learn how to ...
9,511 views
How to add a second data series to an existing Excel chart. Show calculating the cumulative frequencies and adding a second ...
10,060 views