Upload date
All time
Last hour
Today
This week
This month
This year
Type
All
Video
Channel
Playlist
Movie
Duration
Short (< 4 minutes)
Medium (4-20 minutes)
Long (> 20 minutes)
Sort by
Relevance
Rating
View count
Features
HD
Subtitles/CC
Creative Commons
3D
Live
4K
360°
VR180
HDR
946,000 results
histogram frequency density
cumulative frequency igcse maths
histogram relative frequency
frequency polygon
ogive
histogram excel
histogram matematik
histogram photography explained
histogram spss
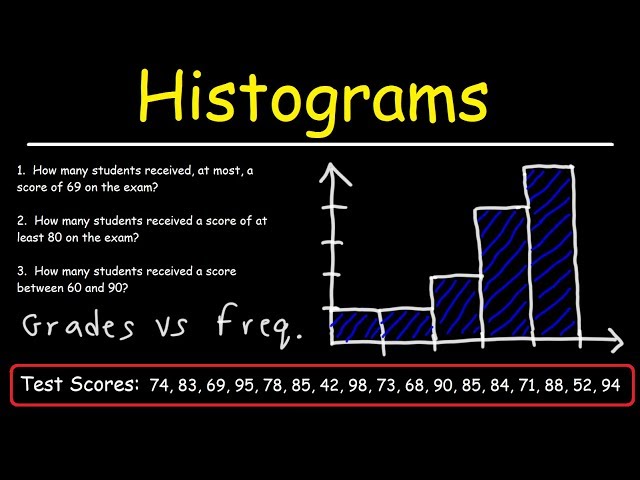
Histograms are one of the most basic statistical tools that we have. They are also one of the most powerful and most frequently ...
912,860 views
8 years ago
The histogram, a very useful exposure tool. In this video I explain how one can interpret a histogram. ______ Royalty-free music ...
340,603 views
This video is for students aged 14+ studying GCSE Maths. A video explaining how to draw a histogram from a grouped frequency ...
151,003 views
2 years ago
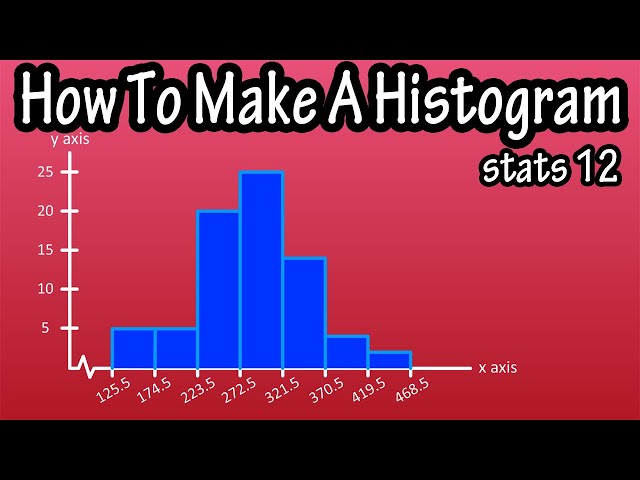
This statistics video tutorial explains how to make a histogram using a frequency distribution table. Statistics - Free Formula Sheet: ...
772,217 views
6 years ago
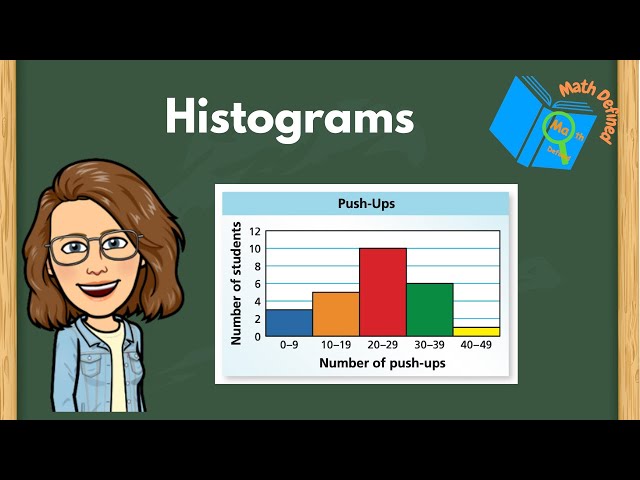
In this video we discuss what is a histogram, and how to construct make a histogram graph from a frequency distribution table in ...
261,534 views
5 years ago
In this video, I will show you how to create a histogram from a frequency table. Histograms are graphical representations of data ...
121,169 views
In this video you will learn how a histogram is different than a bar chart. Welcome to MooMooMath where we upload a new Math ...
234,682 views
9 years ago
A video revising the techniques and strategies for drawing and interpreting histograms (Higher Only). Join this channel to get ...
169,507 views
3 years ago
Learn to make bar plots in Python and compare categorical data visually. We'll explore vertical & horizontal bars, color ...
96 views
1 day ago
A Histogram is a useful tool for checking exposure and improving your photography. The first 1000 people to use the link will get a ...
202,325 views
In this video tutorial we're going to have a look at how to make a histogram in Excel, which is one of the ways to create a clear ...
892,534 views
Want to take amazing wildlife photos? Check out my new course with 20 modules and over 5 hours of content, no fluff!
424,728 views
Master Wildlife Photo Editing: https://www.markdumbleton.com/the-wildlife-edit-course?video=D0DxtixmFRY Free Weekly Photo ...
10,188 views
1 year ago
View more at http://www.MathAndScience.com. In this lesson, you will learn what a histogram is and how histograms are used in ...
49,968 views
In this video, I explain Prometheus histograms (for now only the "classic" ones that have been in Prometheus for around a decade ...
19,823 views
Understanding the histogram in photography and how to use the histogram for Fujifilm cameras. Also covered is Exposing to the ...
139,912 views
4 years ago
The Histogram is one of the most important things to understand in Photography. This video serves as a beginners guide to the ...
41,452 views
This example shows how to make a histogram. Remember that the horizontal axis represents the values of the variables.
1,233,379 views
14 years ago
Join my newsletter https://steven-bradburn.beehiiv.com/subscribe In this video tutorial, I will show you how to create a frequency ...
556,395 views
Courses on Khan Academy are always 100% free. Start practicing—and saving your progress—now: ...
483,093 views
10 years ago


![What is a Histogram? (Data Analysis & Statistics) - [6-8-29]](/api/proxy/image?url=https%3A%2F%2Fi.ytimg.com%2Fvi%2FBwpkZQZ3ttw%2Fsddefault.jpg)