Upload date
All time
Last hour
Today
This week
This month
This year
Type
All
Video
Channel
Playlist
Movie
Duration
Short (< 4 minutes)
Medium (4-20 minutes)
Long (> 20 minutes)
Sort by
Relevance
Rating
View count
Features
HD
Subtitles/CC
Creative Commons
3D
Live
4K
360°
VR180
HDR
5,714,290 results
area chart
excel charts
excel line graph
stacked bar chart excel
excel linear regression
bar graph animation
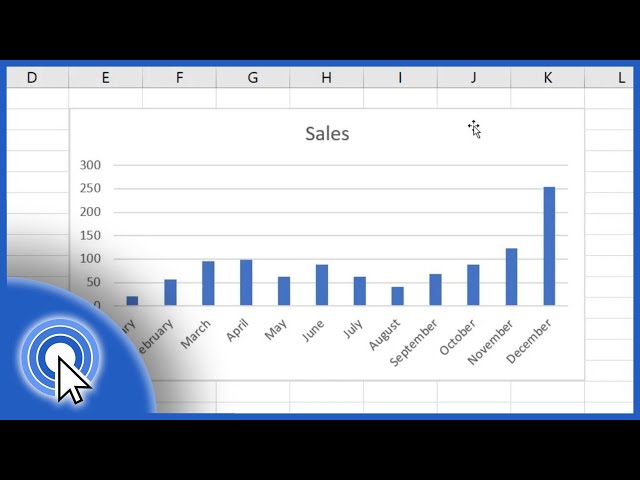
In this video tutorial, you'll see how to create a simple bar graph in Excel. Using a graph is a great way to present your data in an ...
1,730,594 views
6 years ago
In this video, you will learn how to create different types of charts in Microsoft Excel, such as column charts, bar charts, stacked ...
363,986 views
2 years ago
Create 10 Professional Dashboards (ONLY $9.99!) ▶️https://bit.ly/3W1WBTR Download the Project File here: ...
636,760 views
9 years ago
Join my newsletter https://steven-bradburn.beehiiv.com/subscribe In this tutorial, I'm going to show you how to create a basic bar ...
227,843 views
4 years ago
Learn Excel in just 2 hours: https://kevinstratvert.thinkific.com In this step-by-step tutorial, learn how to pull together charts in Excel.
1,149,313 views
Create charts that wow your audience. Learn the secrets now—start today! https://link.xelplus.com/yt-g-stacked-charts-course ...
595,800 views
7 years ago
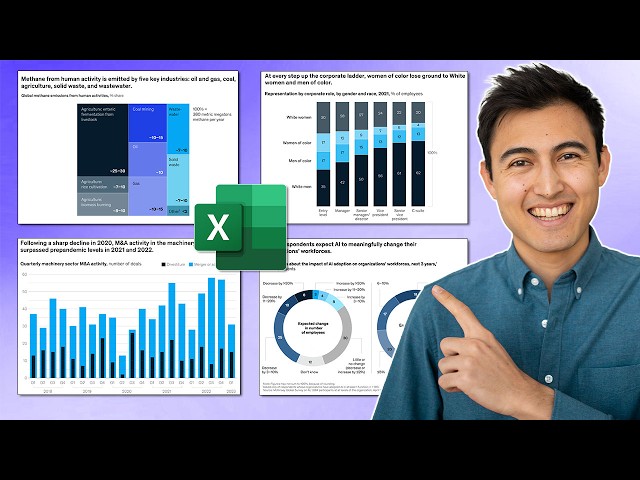
Make McKinsey Charts and Visuals in Excel from scratch. Take our PowerPoint Course: ...
431,560 views
This video will go over creating dashboards in Excel using pivot tables, pivot charts, and slicers. If you want to follow along with ...
826,516 views
Sign up for our Excel webinar, times added weekly: https://www.excelcampus.com/blueprint-registration/ PART 1: ...
15,152,274 views
10 years ago
Try think-cell for free: https://tinyurl.com/xelplus Create professional business charts in Excel—start here ...
601,525 views
1 year ago
From "Introduction to Statistics, Think & Do" by Scott Stevens, Amazon: https://amzn.to/2zJRCjL This demonstration shows you ...
2,230,907 views
11 years ago
In this video tutorial, we'll have a look at how to add a target line in an Excel graph, which will help you make the target value ...
445,974 views
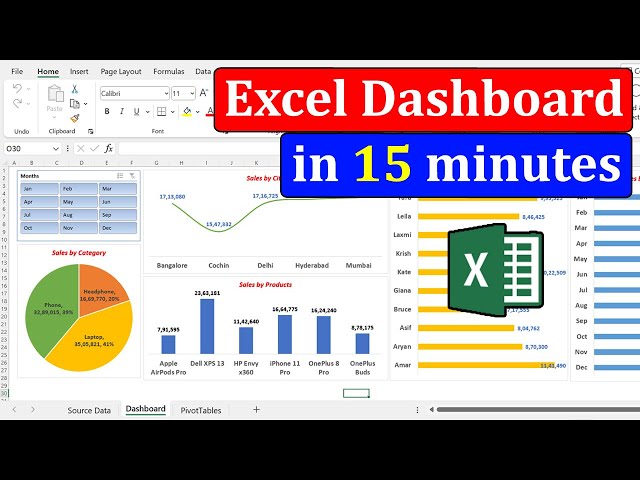
How to create a Sales Dashboard Report in Microsoft Excel. Download Sales data for creating the Dashboard report and the ...
1,224,346 views
3 years ago
In this Training Video I'll show you how to create a Pivot Table in Excel with dynamic Progress Doughnut Chart and a Dashboard.
2,458,124 views
If you find my Excel videos useful and would like to support me, you can buy me a coffee ...
30,950 views
In this tutorial I show you ow to make a grouped bar chart in Microsoft Excel! The first thing is to make sure that your data is set up ...
45,554 views
In this video i will explain how to create a bar chart with two series and green and red arrows for the differences. Data labels will ...
242,160 views
Create charts that wow your audience. Learn the secrets now—start today! https://link.xelplus.com/yt-g-basics-charts-course ...
1,170,240 views
A brief tutorial on how to select several different data sets from a table and incorporate them into a chart for easier debriefing of ...
165,013 views
Learn how to create a professional-looking bar graph in Excel with this easy-to-follow tutorial. In addition, discover five expert ...
16,784 views
Watch this tutorial to find out how to create a bar graph in Microsoft Excel. MORE HOW TO VIDEOS: How To Use Snapchat ...
37,687 views
In this video I show you how to create a CLUSTERED COLUMN CHART in Excel, also called a bar chart. Clustered Column charts ...
37,930 views
Hello Friends, In this video you will learn how to create a beautiful Weekly Sales Chart in Excel. Please download this excel file ...
447,737 views
If you liked this video and want to see more content added to this channel, contribute to my Patreon account: ...
725,360 views
Create a bar chart with rounded corners and data labels.
44,950 views
Column charts are used to compare values across categories.
208,293 views
Create advanced excel charts (forecast chart, waterfall chart, column chart etc.) Sign up to Morning Brew: ...
277,608 views
In this beginning level Excel tutorial, learn how to make quick and simple Excel charts that show off your data in attractive and ...
3,390,493 views
This Video Will Show You How To Sort your bars in an Excel Bar Chart If you'd like to support FreeLearning Please Consider ...
16,502 views
Quick guide on the most versatile chart in Excel (everywhere, actually). Compare categories or show development over time, this ...
1,762 views


![How to make a bar graph/chart in Excel [EASY 3 STEPS]](/api/proxy/image?url=https%3A%2F%2Fi.ytimg.com%2Fvi%2FjwU0pzxRki0%2Fsddefault.jpg)