Upload date
All time
Last hour
Today
This week
This month
This year
Type
All
Video
Channel
Playlist
Movie
Duration
Short (< 4 minutes)
Medium (4-20 minutes)
Long (> 20 minutes)
Sort by
Relevance
Rating
View count
Features
HD
Subtitles/CC
Creative Commons
3D
Live
4K
360°
VR180
HDR
3,631,892 results
recharts
d3.js tutorial
chart js tutorial
3d Geo Data Viz: From Insight to Data Art Mobility data provides a fascinating insight into how cities function from a transit point of ...
38,119 views
4 years ago
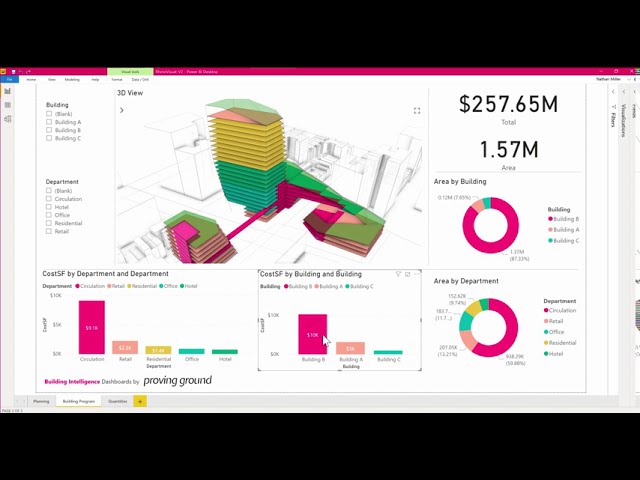
This demo of the 3D Power BI visual - including in our Rhino Semantic toolkit - shows the use of a 3D model to support ...
53,679 views
5 years ago
Discover how to build impressive 3D maps that bring your data to life! This video shows easy tools and techniques to create ...
23,896 views
4 months ago
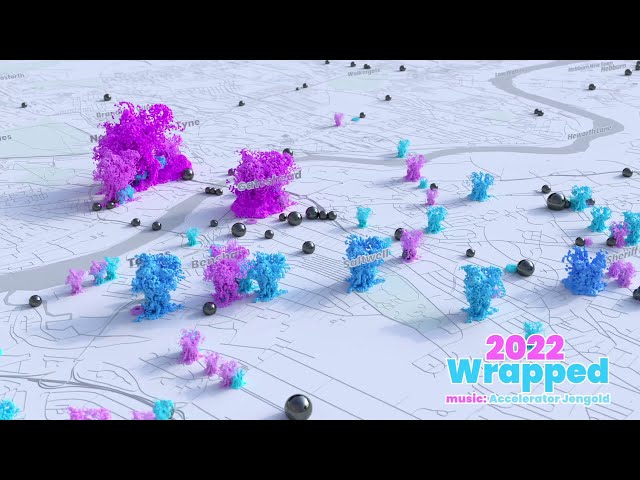
A collection of concepts, projects and work in progress from the year.
5,957 views
2 years ago
... charts, and other data visualizations you see on the web today. https://fireship.io/lessons/realtime-charts-d3-firebase/ #javascript ...
580,682 views
Use the code "DATA" to get 25% off The Big Nodebook!!! https://mtranimationgumroad.gumroad.com/l/thebignodebook/DATA New ...
96,182 views
2 months ago
In this video Rob, a Kaggle Grandmaster, quickly and humorously walks through each of the popular plotting and data ...
106,358 views
3 years ago
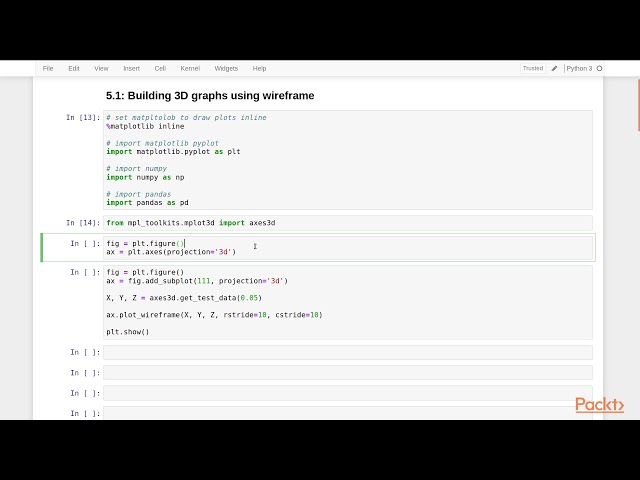
In this video we learn how to visualize 3D plots in Matplotlib. ◾◾◾◾◾◾◾◾◾◾◾◾◾◾◾◾◾ Programming Books ...
142,376 views
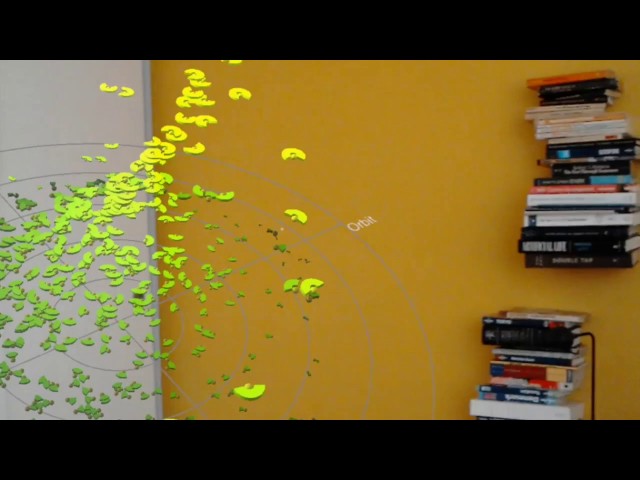
An animated scatter plot of all stocks in the S&P. Drill down detail is available simply by gazing at one of the visual elements, or as ...
7,922 views
8 years ago
Learn to create captivating narratives by combining digital illustration and collage techniques to design informative and ...
9,405 views
Rayshader is an open source package that uses elevation data in a base R matrix and a combination of raytracing, hillshading ...
6,058 views
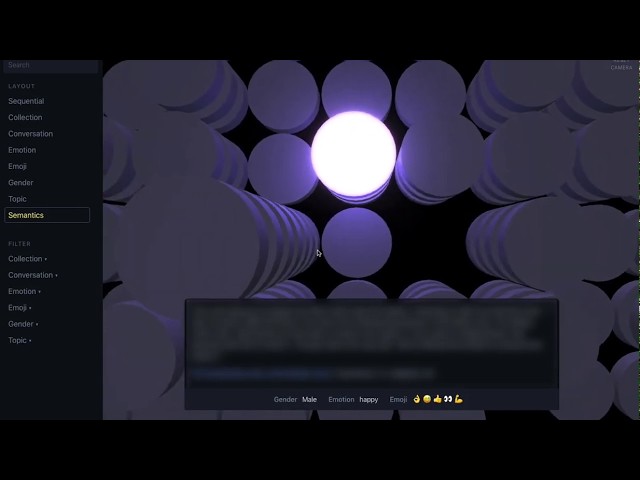
Made during a hack week at work. This is a proof of concept of a 3D faceted search UI allowing filtering and partitioning over ...
748 views
This video tutorial has been taken from Data Visualization Recipes with Python and Matplotlib 3. You can learn more and buy the ...
247 views
6 years ago
Today, we're exploring how to turn data into real-time, interactive 3D visualizations using Spline. You'll learn how to build dynamic ...
6,113 views
3 months ago
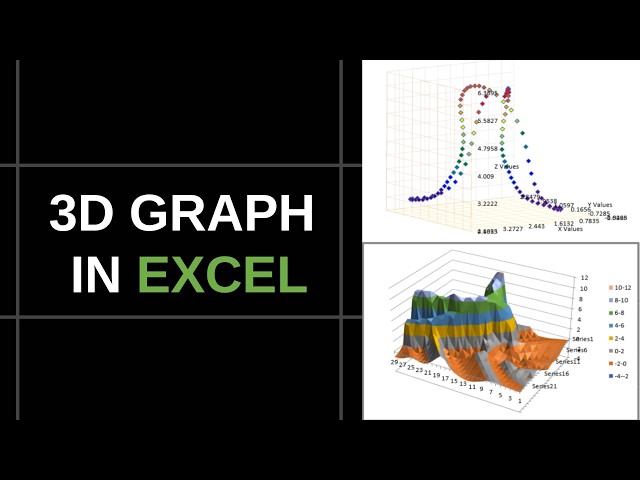
Create stunning 3D graphs directly in Excel using XYZ Mesh! This tutorial shows you step-by-step how to transform simple XYZ ...
758 views
5 months ago
Find more cool demos here: https://www.hightopo.com/demos/en-index.html Hightopo developed a powerful web-based 2D and ...
1,053 views
Datamap Visualization in Blender 3.0 Geometrynodes If you want to see more Blender related stuff: Current projects of mine: ...
56,400 views
Hightopo offers a powerful, web-based 2D and 3D rendering engine which provides rich display effects for data visualization.
27,308 views
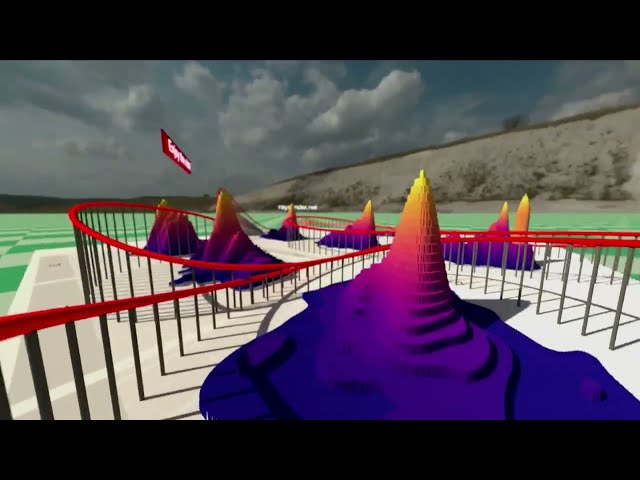
Have you ever had so much fun building a data visualization that it felt like a thrill ride? What if your dataviz actually WAS a thrill ...
859 views
Building an Entire City in R: Interactive 3D Data Visualization with Rayrender by Tyler Morgan-Wall Visit https://rstats.ai/gov/ to ...
2,566 views