Upload date
All time
Last hour
Today
This week
This month
This year
Type
All
Video
Channel
Playlist
Movie
Duration
Short (< 4 minutes)
Medium (4-20 minutes)
Long (> 20 minutes)
Sort by
Relevance
Rating
View count
Features
HD
Subtitles/CC
Creative Commons
3D
Live
4K
360°
VR180
HDR
74,493 results
boxplot with outliers
quantile plot
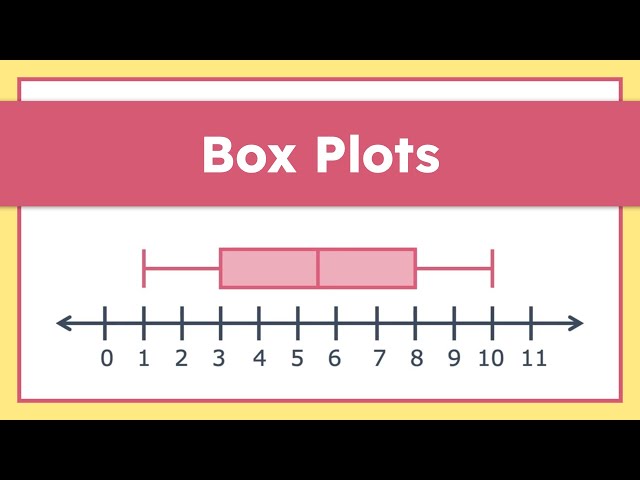
box plot explained
capture recapture gcse maths
box plot diagram explained hindi
cumulative frequency gcse
dot plot
heat map
z score
percentiles
histogram
5 number summary
frequency table
This problem is from the following book: http://goo.gl/t9pfIj We first see that box and whisker plots are graphical displays of the five ...
230,127 views
8 years ago
How do you compare box plots? In this video, I review what you can compare with different box and whisker plots. Items you can ...
71,756 views
Video to accompany the open textbook Math in Society (http://www.opentextbookstore.com/mathinsociety/). Part of the ...
204,210 views
13 years ago
The full lesson and more can be found on our website at https://mathsathome.com/understand-and-compare-box-plots/ In this ...
32,294 views
3 years ago
Corbettmaths - This video explains how to compare box plots (box and whisker diagrams).
104,294 views
12 years ago
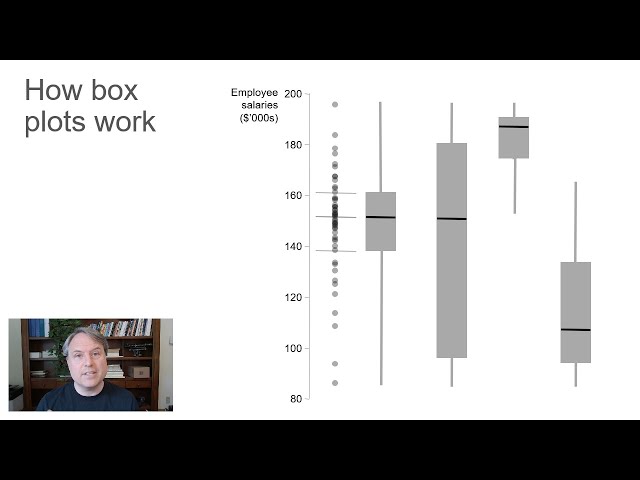
... 50 essential chart types (including box plots). Course info page: https://www.practicalreporting.com/practical-charts-on-demand.
95,553 views
5 years ago
This video provides an example of how to compare key values on two box and whisker plots. http://mathispower4u.com.
98,804 views
11 years ago
https://www.buymeacoffee.com/TLMaths Navigate all of my videos at https://www.tlmaths.com/ Like my Facebook Page: ...
67,383 views
7 years ago
... also compare it to the data all right so I hope that helps you with the connection between histograms box plots and their data.
127 views
Welcome to Box and Whisker Plots Explained with Mr. J! Need help with how to interpret box and whisker plots (also called box ...
880,044 views
2 years ago
Learn all about box plots in this comprehensive IXL tutorial! Box plots, also known as box-and-whisker plots, are powerful tools for ...
18,557 views
9 months ago
If you have any questions leave a comment down below! ⚡️ Like and subscribe for more content like this!
668 views
1 year ago
Compare data sets using boxplots.
1,374 views
We can compare the visual overlap of two sets of data by looking at box plots from a box plot we can compare medians ranges ...
185 views
This video provides some key things to look for when comparing box plots.
60 views
10 years ago
This video shows how to interpret and compare box plots.
505 views
Join me as I show you distributions of box plots (symmetric, skewed left and skewed right), as well as how to compare the five key ...
8,219 views
After drawing cumulative frequency graphs and box plots, how do you make comparisons between them. (Always make 2 ...
40 views
4 years ago
This video shows you how to compare box plts, a popular GCSE exam question.
18,261 views
Sal solves practice problems where he thinks about which data displays would be helpful in which situations. Practice this lesson ...
273,011 views


![A-Level Maths: L1-03 [Data: Comparing Box Plots]](/api/proxy/image?url=https%3A%2F%2Fi.ytimg.com%2Fvi%2FYd31wHMxS2M%2Fsddefault.jpg)