ViewTube

ViewTube
Sign inSign upSubscriptions
Filters

Upload date

Type

Duration

Sort by

Features

Reset

78 results

مهدی حسینی
012 Integrating Chart JSUdemyiIran
14:36
012 Integrating Chart JSUdemyiIran

3 views

6 days ago

The Debug Zone
How to Add Custom Data to Tooltips in Chart.js for Enhanced Visuals

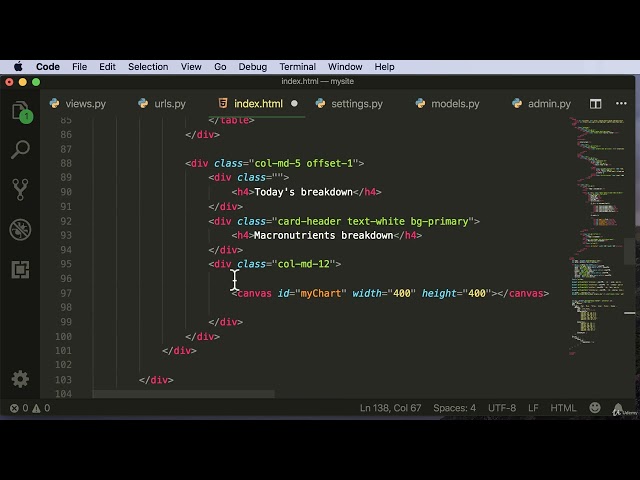
In this video, we'll explore the powerful capabilities of Chart.js and how you can elevate your data visualizations by adding custom ...

1:29
How to Add Custom Data to Tooltips in Chart.js for Enhanced Visuals

0 views

4 days ago

Sheryians Coding School
Full Dev Roadmap Starts Now | Sheryians Content Chart

Instructor in this video: Harsh Vandana Sharma Don't forget to LIKE this video, SUBSCRIBE for more Web Development ...

7:37
Full Dev Roadmap Starts Now | Sheryians Content Chart

25,301 views

3 days ago

The Homemade Coder
Write Anything… This React App Detects Your Emotion!(React + Tailwind CSS + Chart.js + LocalStorage)

Build a beautiful React Mood Tracker App that detects your emotion from the text you write! In this tutorial, we use React + Tailwind ...

33:51
Write Anything… This React App Detects Your Emotion!(React + Tailwind CSS + Chart.js + LocalStorage)

0 views

2 days ago

PictureThisCoding
Expense Chart - From Blank to Built

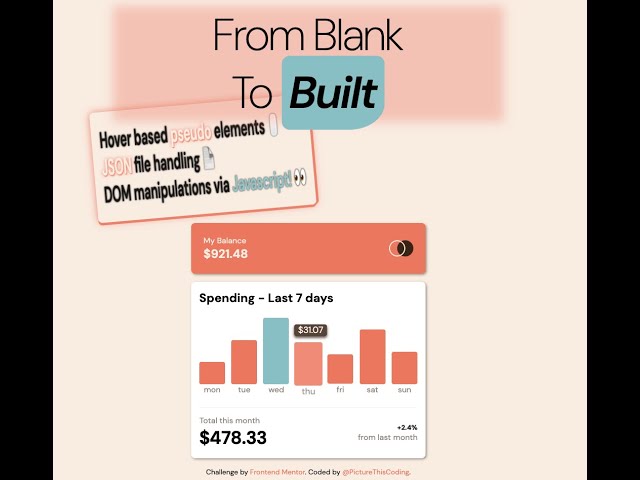
From Blank to Built — in this video I take the “Expenses chart component” Frontend Mentor challenge and turn it into a fully ...

4:09
Expense Chart - From Blank to Built

0 views

6 days ago

MoneyMap Academy
Chart Moving Averages in React | 10EMA, 30EMA & 200EMA Explained (2024)

In this tutorial, you'll learn how to chart moving averages (10EMA, 30EMA, 200EMA) using React, Express, and Node.js as part of ...

6:20
Chart Moving Averages in React | 10EMA, 30EMA & 200EMA Explained (2024)

0 views

6 days ago

Anele Mbanga
Create AMAZING Apex Charts in Minutes with HTML Attributes

Welcome to the demo video of SithasoApex – ApexCharts More Simplified! This repository offers a cleaned-up, ...

17:12
Create AMAZING Apex Charts in Minutes with HTML Attributes

24 views

4 days ago

MoneyMap Academy
Chart Daily Key Levels in React | Full MERN Data Visualization 2024

In this lesson, you'll learn how to chart daily key levels using React, Express, and Node.js — a critical feature for building ...

6:03
Chart Daily Key Levels in React | Full MERN Data Visualization 2024

0 views

7 days ago

مهدی حسینی
014 Fixing Alignment IssueUdemyiIran
1:46
014 Fixing Alignment IssueUdemyiIran

3 views

6 days ago

مهدی حسینی
011 Adding NavbarUdemyiIran
3:41
011 Adding NavbarUdemyiIran

7 views

6 days ago

JSXGraph
Sr Smith: A Web-Based RF Smith Chart App using JSXGraph and JessieCode

Sebastian Tabares Amaya October 7 – 9, 2025 6. International JSXGraph Conference https://jsxgraph.org/conf2025/

28:00
Sr Smith: A Web-Based RF Smith Chart App using JSXGraph and JessieCode

0 views

3 days ago

quantlabs
AI Reveals Pro HFT Secrets: FPGA Code, Low-Latency Strategies & Live Trading Prep

In this deep-dive video, I unveil a game-changing development in my quantitative trading process. As I prepare to go live, I'm ...

35:40
AI Reveals Pro HFT Secrets: FPGA Code, Low-Latency Strategies & Live Trading Prep

149 views

7 days ago

𝐀𝐌𝐀𝐍-𝐊𝐇𝐔𝐒𝐇𝐈
Aman Prediction Number Trends Base |1 Minute Auto Update | Big & Small Chart UI Design | HTMLProject

Welcome to **Aman Prediction Number Trends Base** ⚡ This HTML project shows Real-Time Auto Updating Prediction System ...

1:30
Aman Prediction Number Trends Base |1 Minute Auto Update | Big & Small Chart UI Design | HTMLProject

65 views

7 days ago

EscapeRoomCoding
CREATE a Dividends Dashboard with Python and Flask to Track Payouts?

Build a Dividends Dashboard in Python & Flask | Track Monthly, Yearly & Ticker-Wise Payouts - Take your Investment Tracker to ...

1:09:43
CREATE a Dividends Dashboard with Python and Flask to Track Payouts?

23 views

2 days ago

tech savant
#js #loop #loopforpragraphs js loop for multiple paragraphs
1:01
#js #loop #loopforpragraphs js loop for multiple paragraphs

0 views

6 days ago

Max Mat - 💵Upwork Freelance Success
Medical Helper & Flowchart: Create HTML Pages Like a Pro! #shorts

Video shows flowchart display and medical helper integration. Then, an HTML page is made using Mermaid.js for visualization ...

0:36
Medical Helper & Flowchart: Create HTML Pages Like a Pro! #shorts

57 views

7 days ago

Yasser Munir
Say goodbye to the debt ledger! A professional web-based program for managing supplier and custom...

In this video, we'll review a comprehensive, professional web-based program for managing supplier and customer accounts, built ...

3:15
Say goodbye to the debt ledger! A professional web-based program for managing supplier and custom...

710 views

5 days ago

TechWhiz Mrunu
HeatScraper | PCCOE Hackathon 2025 | AI for climate change

About HeatScraper HeatScraper is a full-stack, community-driven climate awareness platform designed to map heat intensity, ...

4:47
HeatScraper | PCCOE Hackathon 2025 | AI for climate change

8 views

7 days ago

Uplatz
Data Visualization: Turning Complex Data Into Clear, Insightful Stories | Uplatz

Data visualization is the bridge between raw data and human understanding. It transforms numbers, tables, and datasets into ...

6:48
Data Visualization: Turning Complex Data Into Clear, Insightful Stories | Uplatz

0 views

4 days ago

CPA Samuel Otieno
BDA-AMA -Budget Analysis and Presentation

Join a learning experience designed to equip you with real-world expertise. Courses Offered: ✓ Business Data Analytics (BDA) ...

1:16:46
BDA-AMA -Budget Analysis and Presentation

44 views

5 days ago