Upload date
All time
Last hour
Today
This week
This month
This year
Type
All
Video
Channel
Playlist
Movie
Duration
Short (< 4 minutes)
Medium (4-20 minutes)
Long (> 20 minutes)
Sort by
Relevance
Rating
View count
Features
HD
Subtitles/CC
Creative Commons
3D
Live
4K
360°
VR180
HDR
2,694,769 results
chart react
chart js angular
chart js react
In this video I go over one of my favorite chart libraries in react, ChartJS. Learn ReactJS By Building 6 Projects: ...
71,075 views
1 year ago
In this video we will take a peak at Chart.js which is a JavaScript library for creating beautiful charts and graphs and inserting them ...
511,681 views
8 years ago
Chart JS tutorial for beginners | Chart.JS Tutorial. In this video you will explore how to use chart js. This is a chart js tutorial for ...
122,935 views
4 years ago
After watching this video you will be able to use Chart.js in your projects. We will cover everything from a basic bar chart to display ...
16,197 views
3 years ago
Learn how to make charts using Chart.js in React in this complete beginners tutorial. We'll guide you through the process of ...
72,269 views
2 years ago
Fragen oder Probleme? Werde Teil der Community! (Kostenlos) Discord Server: https://discord.gg/NV2NrXA Unterstütze den ...
32,820 views
Part 1 : Create Responsive Admin Dashboard using Html CSS & Javascript | Simple Dashboard Template Design ...
237,454 views
Build a dynamic travel dashboard with personalized travel suggestions, charts and tables using React Router v7. Upgrade this ...
813,879 views
6 months ago
How to create real-time line chart with javascript using Plotly.js. The chart can be used to stream a real-time data with automatic ...
139,156 views
7 years ago
Here in this tutorial, you will learn how to create a chart for your website using chart.js. this is a very simple and easy tutorial.
56,950 views
Updating the chart dynamically required for real data analysis or data visualization. To achieve this we are using socket.io for ...
68,202 views
6 years ago
Learn Data Visualization with D3, JavaScript, and React. Part 2: https://youtu.be/H2qPeJx1RDI Created by @currankelleher .
516,679 views
How to add charts in HTML websites is going to be the question we are tackling in today's video. A possible answer to this ...
22,656 views
5 years ago
Advance Gantt Chart JS Series Part 1 In this video we will explore how to create an advance gantt chart in chart js. This is the first ...
32,644 views
Create Beautiful Line Charts in D3 - Beginners Guide. In this three-part series, I'll walk through building a basic D3.js line chart, ...
23,914 views
In this video we will learn how to add ChartJs into our Vue 3 project and we will set the basic configuration.
27,637 views
20.7K subscribers
In this tutorial, you will learn how to fetch data from a JSON file and display it in interactive charts using Chart.js and JavaScript.
24,634 views
Check out my courses to become a PRO! https://developedbyed.com/ Do you like data and want to display it with beautifully ...
95,416 views
Get my Source Codes and support the channel* ❤️: https://www.buymeacoffee.com/fabiomusanni/extras ⬇️ LEARN ON THE ...
5,892 views
11 months ago
Data-Driven Documents or D3 is a JavaScript library for drawing SVGs with data. It's the magic behind many of the graphs, charts, ...
580,706 views
The lesson continues working with tabular data (CSV) and examines how to graph the data in an HTML5 canvas with Chart.js.
436,452 views
Tous mes cours sur l'École du Web (pour les obtenir tous d'un coup) : https://www.ecole-du-web.net/ Tous mes cours sur ...
31,086 views
Shadcn/ui keeps paying dividends. Doing charts right is hard, so hyped we have a great starting point in React now. SOURCE ...
120,956 views
In this video I will be teaching how to create graphs / charts in ReactJS using Chart.JS.
169,564 views
In this video, we create a polar area chart with chart.js. Subscribe for more free tutorials https://goo.gl/6ljoFc, Buy this series and ...
16,377 views
9 years ago
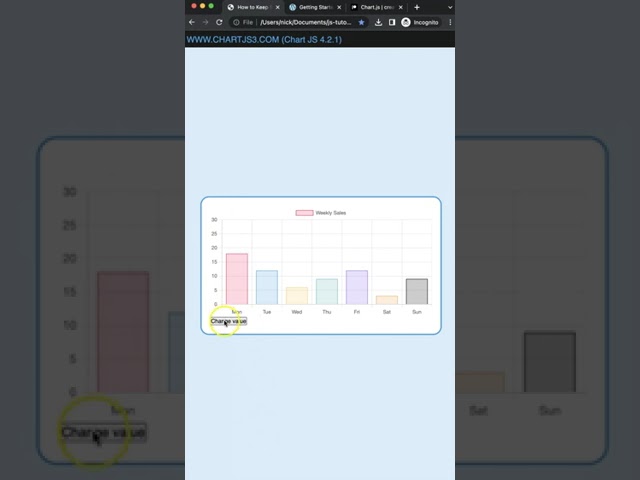
How to Keep Y Scale at Max 100 Percent in Chart JS 4 Short Watch Full Link: https://youtu.be/wJonULGQO1k In this video we will ...
2,681 views


![Diagramme mit JavaScript und Chart.JS einfach anlegen und anpassen! [TUTORIAL]](/api/proxy/image?url=https%3A%2F%2Fi.ytimg.com%2Fvi%2FP4QY81Ym1rE%2Fsddefault.jpg)