Upload date
All time
Last hour
Today
This week
This month
This year
Type
All
Video
Channel
Playlist
Movie
Duration
Short (< 4 minutes)
Medium (4-20 minutes)
Long (> 20 minutes)
Sort by
Relevance
Rating
View count
Features
HD
Subtitles/CC
Creative Commons
3D
Live
4K
360°
VR180
HDR
10,866,267 results
excel stacked bar chart
bar chart excel
line chart trading
Learn Excel in just 2 hours: https://kevinstratvert.thinkific.com In this step-by-step tutorial, learn how to pull together charts in Excel.
1,191,513 views
2 years ago
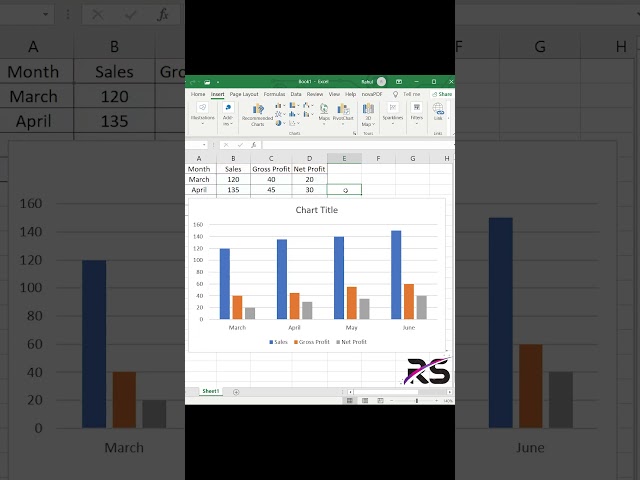
In this beginning level Excel tutorial, learn how to make quick and simple Excel charts that show off your data in attractive and ...
3,406,951 views
7 years ago
Create charts that wow your audience. Learn the secrets now—start today! https://link.xelplus.com/yt-g-basics-charts-course ...
1,174,973 views
8 years ago
Learn how to create a professional, efficient, and visually appealing dashboard in Excel from scratch! This step-by-step tutorial will ...
189,419 views
8 months ago
https://www.other-levels.com To Download our Templates & Get Free Datasets Dynamic & Interactive Dashboard - Finance Status ...
6,799,294 views
5 years ago
Sign up for our Excel webinar, times added weekly: https://www.excelcampus.com/blueprint-registration/ PART 1: ...
15,187,799 views
10 years ago
BLACK FRIDAY: Save up to 45% https://link.xelplus.com/yt-bf-savings ⯆ Download the timeline chart template: ...
323,049 views
2 weeks ago
In this video i will explain how to create a bar chart with two series and green and red arrows for the differences. Data labels will ...
246,707 views
3 years ago
GET THIS TEMPLATE PLUS 52 MORE here: ...
2,142,086 views
This video will go over creating dashboards in Excel using pivot tables, pivot charts, and slicers. If you want to follow along with ...
831,774 views
Make McKinsey Charts and Visuals in Excel from scratch. Take our PowerPoint Course: ...
437,372 views
Build an awesome interactive Excel dashboard in just 15 minutes. Take our Excel for Business & Finance Course: ...
1,714,907 views
Download Ultimate Excel Gantt Chart Template: https://excelfind.com/ultimate-excel-gantt-chart ▻ Discover all our Excel ...
3,038,937 views
4 years ago
Hello Friends, In this video you will learn how to create a beautiful Weekly Sales Chart in Excel. Please download this excel file ...
450,068 views
In this video tutorial, you'll see how to create a simple bar graph in Excel. Using a graph is a great way to present your data in an ...
1,767,972 views
6 years ago
In this video, I show you how to make a line graph in Excel. It's a really simple process, and you can turn any data into a ...
5,640,725 views
Create advanced excel charts (forecast chart, waterfall chart, column chart etc.) Sign up to Morning Brew: ...
281,464 views
In this video, you will learn how to create different types of charts in Microsoft Excel, such as column charts, bar charts, stacked ...
372,620 views
Try think-cell for free: https://tinyurl.com/xelplus Create professional business charts in Excel—start here ...
607,686 views
1 year ago
In this video tutorial for beginners, I will show you how to make charts and graphs in Microsoft Excel. Using data, I will show you ...
392,334 views
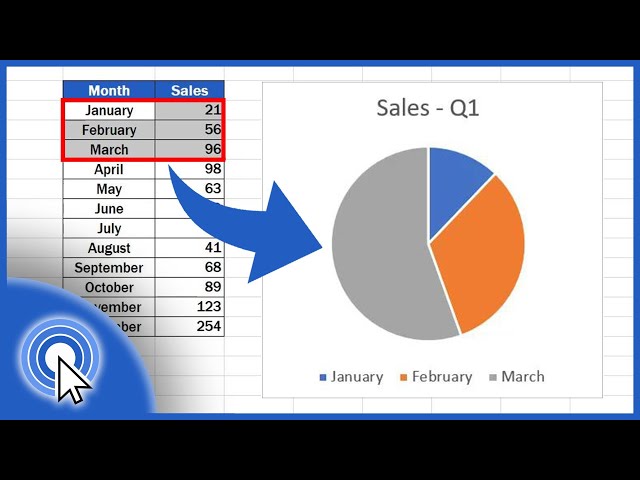
In this video tutorial, you'll see how to create a simple pie graph in Excel. Using a graph is a great way to present your data in an ...
2,223,159 views
Excel tip to make an org chart with the smartart function. #exceltips #exceltricks.
216,331 views
Create charts that wow your audience. Learn the secrets now—start today! https://link.xelplus.com/yt-g-dyn-range-charts-course ...
362,771 views
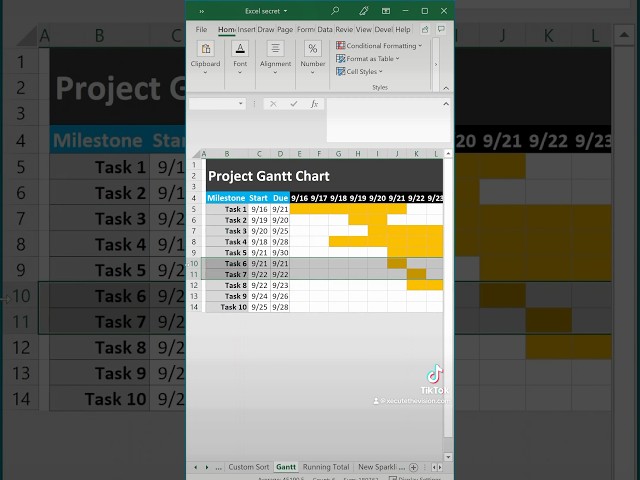
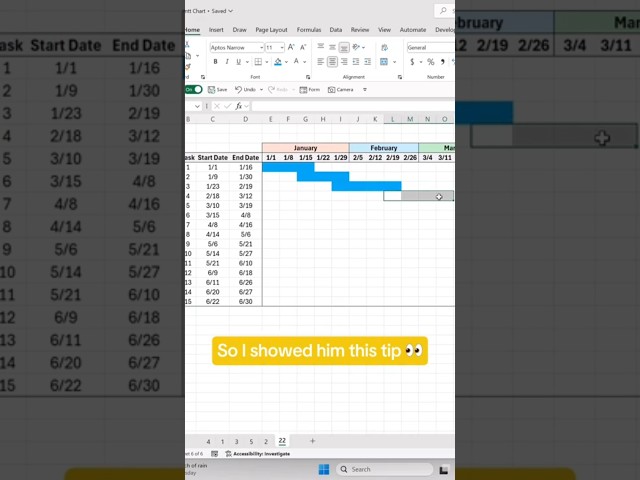
This is how to make a Gantt chart with Excel. Make a Gantt chart in Excel with conditional formatting to show project start and end ...
176,025 views
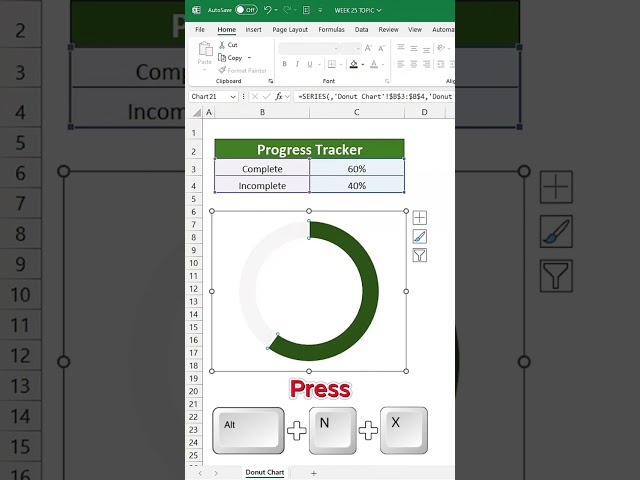
Ever wondered how to make a stunning Donut Chart in just a few simple steps? I'll take you through my process and show ...
29,466 views
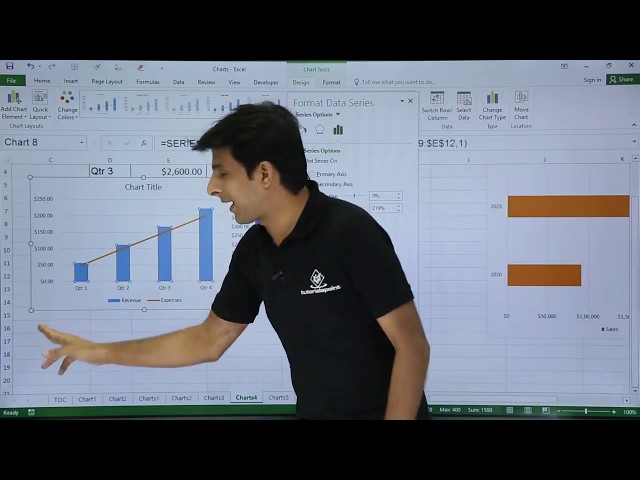
MS Excel - Pie, Bar, Column & Line Chart Lecture By: Mr. Pavan Lalwani Tutorials Point India Private Limited Check out the latest ...
1,241,792 views
Shorts #Excel #MSExcel #ExcelTricks #ExcelTips.
1,386,485 views
excel #exceltips #workhacks #tutorial.
243,757 views
5 months ago