Upload date
All time
Last hour
Today
This week
This month
This year
Type
All
Video
Channel
Playlist
Movie
Duration
Short (< 4 minutes)
Medium (4-20 minutes)
Long (> 20 minutes)
Sort by
Relevance
Rating
View count
Features
HD
Subtitles/CC
Creative Commons
3D
Live
4K
360°
VR180
HDR
10,742,442 results
data visualization ai
data visualization 3d
data visualization excel
data visualization storytelling
data visualization r
data visualization tableau
data visualization in tamil
data visualization python
data visualization course
data visualization tools
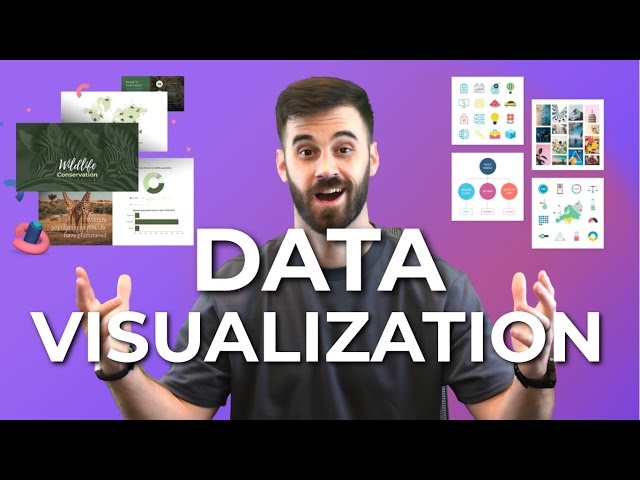
You've probably heard the term data visualization thrown around a lot. It's why you're here, isn't it? So let's make it clear — data ...
171,087 views
3 years ago
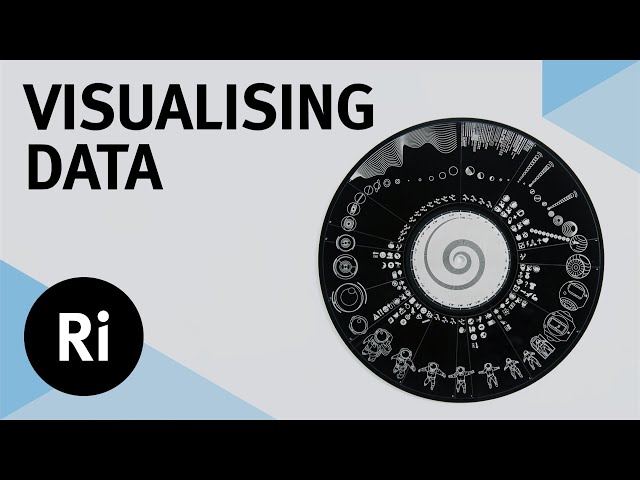
Effective data visualisation comes in many shapes and sizes, but how do you move away from a standard bar chart? Watch the ...
77,344 views
4 years ago
Let's look at how we can implement design concepts and techniques to maximize the impact of our dashboards and reports.
82,454 views
View full lesson: http://ed.ted.com/lessons/david-mccandless-the-beauty-of-data-visualization David McCandless turns complex ...
1,549,456 views
13 years ago
Viewers like you help make PBS (Thank you ) . Support your local PBS Member Station here: http://to.pbs.org/Donateoffbook ...
504,584 views
12 years ago
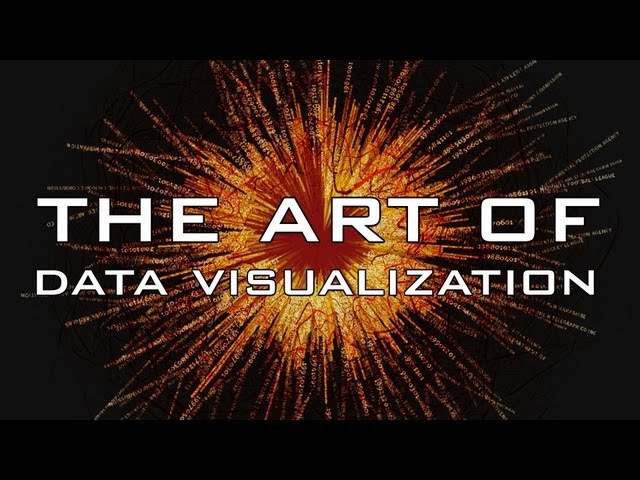
Setup, conflict, resolution. You know right away when you see an effective chart or graphic. It hits you with an immediate sense of ...
597,072 views
6 years ago
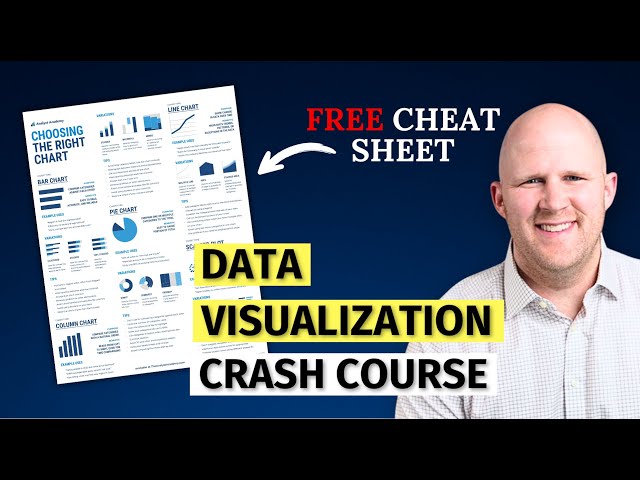
BLACK FRIDAY SALE IS LIVE! Use code "blackfriday" for 20% OFF all courses at TheAnalystAcademy.com -- ⬇️ Links ...
242,163 views
2 years ago
Data visualization is present in every aspect of our lives - but is it really as unbiased as it's said to be? In this SciToons video, learn ...
131,706 views
http://www.ted.com David McCandless turns complex data sets (like worldwide military spending, media buzz, Facebook status ...
399,793 views
15 years ago
Data storytelling is one of the most important skills for any data professional. Those who do it effectively can drive serious impact ...
20,011 views
1 year ago
Dustin hopes that the audience learns how anyone can use data visualization to improve their work, understand their world, and ...
70,954 views
In this video Rob, a Kaggle Grandmaster, quickly and humorously walks through each of the popular plotting and data ...
106,618 views
MENTORSHIP - Applications for the Winter 2025 mentorship cohort are now open! Apply here ...
35,263 views
7 months ago
In this video, we will demonstrate the difference between data visualization charts including: - Bar Chart - Line Chart - Bubble ...
181,306 views
5 years ago
"️ IBM - Data Analyst ...
311,291 views
8 years ago
In this talk, I will chart the course of visual depictions of data over the last 200 years, from the classic data graphics of Playfair and ...
18,723 views
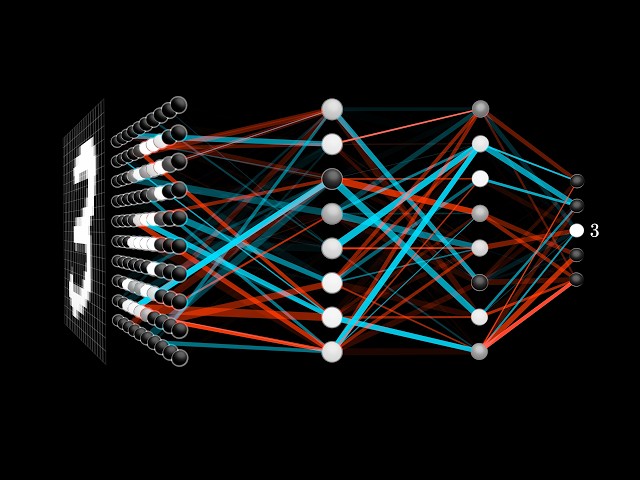
What are the neurons, why are there layers, and what is the math underlying it? Help fund future projects: ...
21,423,023 views
Check out my Super Human Focus & Energy Course Here: https://www.skool.com/lifeyouniversity Throughout history, the most ...
652,583 views
SEO has changed more in the last 2 years than the previous 10 combined and if I had to learn it from scratch in 2025, I wouldn't ...
316,406 views
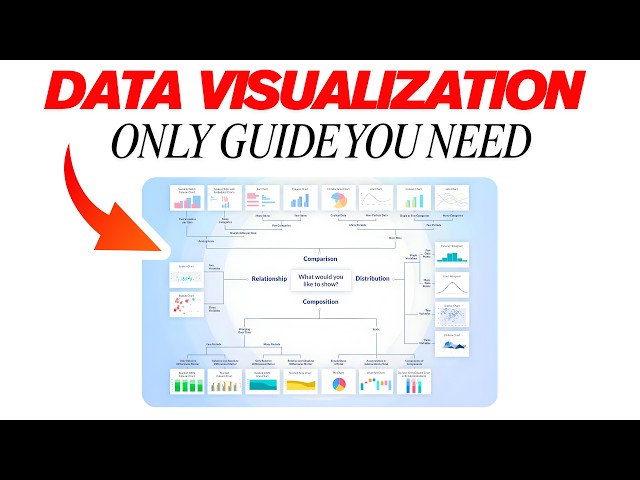
Join my Academy, learn Data & AI skills and land a job https://analyticsautomation.academy/ Mind map available here ...
3,472 views
4 weeks ago
Learn Data Visualization with D3, JavaScript, and React. Part 2: https://youtu.be/H2qPeJx1RDI Created by @currankelleher .
516,829 views
Following a look at 'Sensemaking' Associate Professor Dr Kai Xu delves into some more tricks of the visualisation trade.
75,153 views
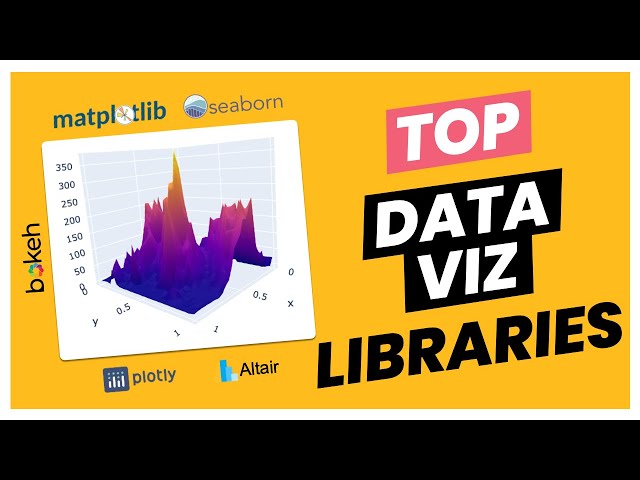
In this video, I will provide a high-level overview of the Top 5 Python libraries for Data Visualization that you can use to create ...
54,290 views