ViewTube

ViewTube
Sign inSign upSubscriptions
Filters

Upload date

Type

Duration

Sort by

Features

Reset

67,809 results

Alex The Analyst
Creating Visualizations using Pandas Library | Python Pandas Tutorials

... Tableau Data Visualization - https://coursera.pxf.io/MXYqaN Udemy Courses: Python for Data Analysis and Visualization- ...

16:50
Creating Visualizations using Pandas Library | Python Pandas Tutorials

109,338 views

2 years ago

Codanics
Data Visualization Masterclass in Python | Matplotlib, Seaborn & Plotly for Beginners to Advanced

Video Description: Master Data Visualization with Python: From Beginner to Advanced! In this comprehensive Data ...

5:27:54
Data Visualization Masterclass in Python | Matplotlib, Seaborn & Plotly for Beginners to Advanced

33,193 views

11 months ago

Alex The Analyst
Learn Pandas in Under 3 Hours | Filtering, Joins, Indexing, Data Cleaning, Visualizations

... https://coursera.pxf.io/AoYOdR Tableau Data Visualization - https://coursera.pxf.io/MXYqaN Udemy Courses: Python for Data ...

2:40:07
Learn Pandas in Under 3 Hours | Filtering, Joins, Indexing, Data Cleaning, Visualizations

105,570 views

1 year ago

EuroPython Conference
Bence Arató - The Python Data Visualization Landscape in 2020

"The Python Data Visualization Landscape in 2020 EuroPython 2020 - Talk - 2020-07-24 - Parrot Data Science Online By Bence ...

30:55
Bence Arató - The Python Data Visualization Landscape in 2020

926 views

5 years ago

PyCharmers
Python PANDAS for Beginners | Data Analysis Made Easy  #coding #pythonlearning #pythonprogramming

Welcome to our comprehensive tutorial on **Python PANDAS for Beginners**! In this video, we will dive into the powerful world of ...

0:37
Python PANDAS for Beginners | Data Analysis Made Easy #coding #pythonlearning #pythonprogramming

79,562 views

1 year ago

Science Communication Hub Nigeria
Introduction to data visualisation and prediction using Python

In our research, hospitals, businesses and work, we accumulate new data every second. Indeed, data is everywhere.

1:01:15
Introduction to data visualisation and prediction using Python

1,012 views

Streamed 5 years ago

OpenMR Benelux
Britta Westner - Data visualization with MNE-Python | OpenMR Virtual 2021

Britta Westner takes us on a journey through the world of data visualization possibilities with MNE-Python on March 25th 2021.

34:15
Britta Westner - Data visualization with MNE-Python | OpenMR Virtual 2021

279 views

4 years ago

Alex The Analyst
Exploratory Data Analysis in Pandas | Python Pandas Tutorials

Take my Full Python Course Here: https://www.analystbuilder.com/courses/pandas-for-data-analysis In this series we will be ...

32:13
Exploratory Data Analysis in Pandas | Python Pandas Tutorials

221,452 views

2 years ago

Alex The Analyst
Data Cleaning in Pandas | Python Pandas Tutorials

Take my Full Python Course Here: https://www.analystbuilder.com/courses/pandas-for-data-analysis In this series we will be ...

38:37
Data Cleaning in Pandas | Python Pandas Tutorials

505,453 views

2 years ago

TrentDoesMath
Hands On Data Science Project: Understand Customers with KMeans Clustering in Python

Try CodeCrafters for free using my referral link: https://app.codecrafters.io/join?via=trentpark8800 In this walkthrough, we dive into ...

1:47:49
Hands On Data Science Project: Understand Customers with KMeans Clustering in Python

84,081 views

1 year ago

Code0n
Data Visualization with Python

Data Visualization with Python. Learn Matplotlib, Numpy, line plot, bar plot, scatter plot, histogram, data set, and distribution ...

1:55:16
Data Visualization with Python

37 views

2 years ago

EuroPython Conference
Dale - Data-visualisation with Python and Javascript: crafting a data-viz toolchain for the web

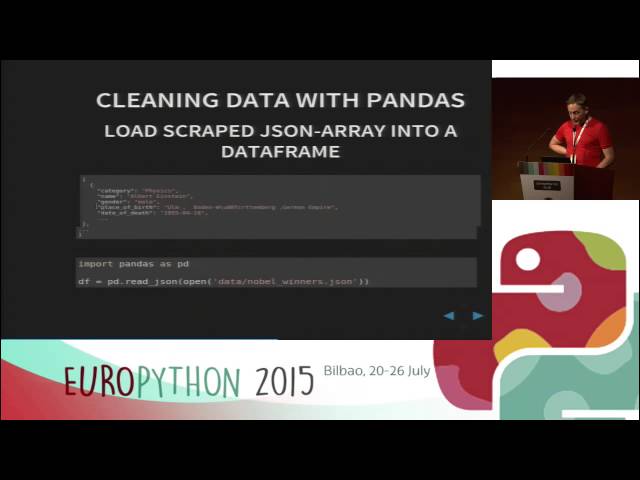
Kyran Dale - Data-visualisation with Python and Javascript: crafting a data-viz toolchain for the web [EuroPython 2015] [21 July ...

35:59
Dale - Data-visualisation with Python and Javascript: crafting a data-viz toolchain for the web

3,060 views

10 years ago

Anaconda, Inc.
Using pandas with Python in Excel

Did you know you can use the pandas Python library inside Microsoft Excel to conduct advanced statistical modeling? Watch here ...

1:00
Using pandas with Python in Excel

38,043 views

2 years ago

Data is Candy
Python Data Visualization With Plotly |  Plotly Tutorial for Data Viz

This tutorial teaches how to use the Plotly library in Python to perform Data visualizations. Recording and Tutorial was made by ...

1:18:32
Python Data Visualization With Plotly | Plotly Tutorial for Data Viz

701 views

5 years ago

CodeEmporium
5 Python Libraries you need for Data Science

You need these python libraries JOIN US ON DISCORD: https://discord.gg/3C6fKZ3E5m 0:00 Introduction 1:34 Data Wrangling ...

12:00
5 Python Libraries you need for Data Science

3,517 views

4 years ago

Code Geek
Data Visualization with Plotly

In this tutorial, you'll learn about how to Data Visualization by using Plotly. Plotly is the best tool in Python for Data Visualization.

1:22:28
Data Visualization with Plotly

147 views

2 years ago

Alex The Analyst
R vs Python | Which is Better for Data Analysis?

R and Python are the programming language of choice for most data analyst and scientists. Let's take a look at them and see ...

11:51
R vs Python | Which is Better for Data Analysis?

242,440 views

4 years ago

Alex The Analyst
Do you need to learn SQL if you can do everything in Python?  #Python #dataanalysis #SQL

Do you need to learn SQL if you can do everything in Python? #python #dataanalysis #SQL. SUBSCRIBE! Do you want to ...

0:51
Do you need to learn SQL if you can do everything in Python? #Python #dataanalysis #SQL

68,250 views

2 years ago

EuroPython Conference
James Saryerwinnie - Debugging Your Code with Data Visualization

Debugging Your Code with Data Visualization [EuroPython 2018 - Talk - 2018-07-26 - Fintry [PyData]] [Edinburgh, UK] By James ...

30:12
James Saryerwinnie - Debugging Your Code with Data Visualization

855 views

7 years ago

OpenMR Benelux
Stephan Heunis - Interactive data visualization with Python, Plotly and Dash | OpenMR Virtual 2021

Stephan Heunis about how to visualize your data interactively and how to deploy a Dash app to let others interact with your data ...

55:40
Stephan Heunis - Interactive data visualization with Python, Plotly and Dash | OpenMR Virtual 2021

121 views

4 years ago