ViewTube

ViewTube
Sign inSign upSubscriptions
Filters

Upload date

Type

Duration

Sort by

Features

Reset

1,467 results

The Sensory Projects
data analysis 2

The final phases of my data analysis explain how I came to know and understand the data generated during the fieldwork ...

10:15
data analysis 2

15 views

11 days ago

Alex The Analyst
Intro to Databricks (Free Edition) | UI Walkthrough

... Google Data Analyst Certification: https://coursera.pxf.io/5bBd62 Data Analysis with Python - https://coursera.pxf.io/BXY3Wy IBM ...

10:45
Intro to Databricks (Free Edition) | UI Walkthrough

11,333 views

13 days ago

Understand Anything
Mastering AI: The Art & Science of Prompt Engineering

Whether you're interested in creative coding or seeking to improve your skills in data analysis, this video will provide you with a ...

5:08
Mastering AI: The Art & Science of Prompt Engineering

0 views

3 weeks ago

Codanics
Dimensions of Data: Univariate, Bivariate, and Multivariate Analysis | Data Analysis Explained

You can book One to one consultancy session with me on Mentoga: https://mentoga.com/muhammadaammartufail ...

19:26
Dimensions of Data: Univariate, Bivariate, and Multivariate Analysis | Data Analysis Explained

261 views

9 days ago

Codanics
Google Sheets Extensions: XLMiner Analysis ToolPak | Data Analysis Made Easy in Urdu

You can book One to one consultancy session with me on Mentoga: https://mentoga.com/muhammadaammartufail ...

16:13
Google Sheets Extensions: XLMiner Analysis ToolPak | Data Analysis Made Easy in Urdu

306 views

8 days ago

DataVerse Studio
Netflix Power BI Dashboard Project | Real-World Power BI Portfolio for Data Analysts

Welcome to Dataverse Studio! In this video, I'll walk you through a real-world Power BI portfolio project — building a full Netflix ...

5:47
Netflix Power BI Dashboard Project | Real-World Power BI Portfolio for Data Analysts

40 views

11 days ago

Data Playground
Master Pivot Tables in 7 Mins | Excel Pivot Tables for Beginners

Learn how to master Pivot Tables in Excel in just 7 minutes — no formulas required! This quick and beginner-friendly tutorial ...

7:08
Master Pivot Tables in 7 Mins | Excel Pivot Tables for Beginners

183 views

2 weeks ago

Kash sales managment software
Kash MCP Server with ChatGPT — Demo

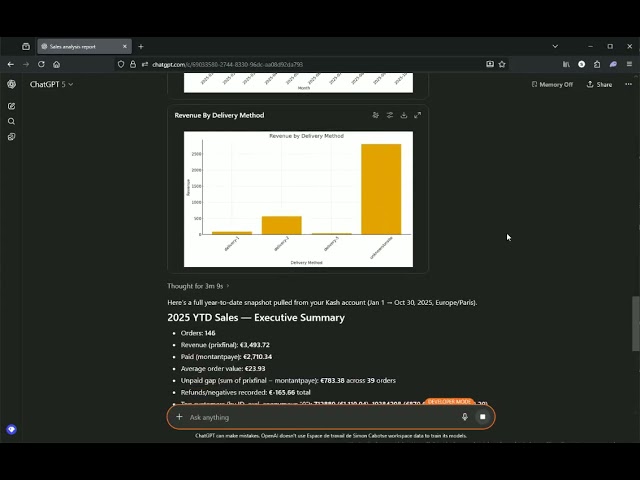
I am just trying here a simple data analysis prompt, but also works : Fetching the list of delivery methods, products, clients, ...

1:45
Kash MCP Server with ChatGPT — Demo

7 views

2 weeks ago

MIT Critical Data
AI in Practice, Hand on AI Workshop for Lahey Leaders - M3: MIMIC - MCP -Models Demo

MIT Critical Data, Lab for Computational Physiology, lcp.mit.edu.

26:02
AI in Practice, Hand on AI Workshop for Lahey Leaders - M3: MIMIC - MCP -Models Demo

25 views

7 days ago

Codanics
Logical Functions (IF, AND, OR) in Google Sheets for Data Analysis | Complete IF–ELSE Tutorial

You can book One to one consultancy session with me on Mentoga: https://mentoga.com/muhammadaammartufail Here is the ...

17:46
Logical Functions (IF, AND, OR) in Google Sheets for Data Analysis | Complete IF–ELSE Tutorial

134 views

1 day ago

Codanics
How to Write a Formula in Google Sheets? | Calculate Percentage in Google Spreadsheet with Example

You can book One to one consultancy session with me on Mentoga: https://mentoga.com/muhammadaammartufail ...

12:04
How to Write a Formula in Google Sheets? | Calculate Percentage in Google Spreadsheet with Example

393 views

4 weeks ago

Analytics Benchmark
Data Analysis Using Power BI – Free Demo Enroll in our Full Power BI :8374015055

Data Analysis Using Power BI – Free Demo Enroll in our Full Power BI Course to become a data analysis pro! Call or ...

1:12:41
Data Analysis Using Power BI – Free Demo Enroll in our Full Power BI :8374015055

50 views

3 weeks ago

Codanics
Create a Scatter Plot in Google Sheets | Data Visualization Tutorial

You can book One to one consultancy session with me on Mentoga: https://mentoga.com/muhammadaammartufail ...

2:59
Create a Scatter Plot in Google Sheets | Data Visualization Tutorial

93 views

13 days ago

Codanics
Create Line Charts in Google Sheets | Data Visualization Tutorial

You can book One to one consultancy session with me on Mentoga: https://mentoga.com/muhammadaammartufail ...

1:59
Create Line Charts in Google Sheets | Data Visualization Tutorial

102 views

13 days ago

Analytics Benchmark
Data Analytics – Free Demo | Analytics Benchmark📱 Call : 8374015055 our Full Data Analytics Course

Data Analytics – Free Demo | Analytics Benchmark Ready to build a career in Data Analytics? Join our Free Data Analytics ...

1:03:51
Data Analytics – Free Demo | Analytics Benchmark📱 Call : 8374015055 our Full Data Analytics Course

78 views

3 weeks ago

Analytics Benchmark
Data Analytics – Free Demo | Analytics Benchmark📱 Call : 8374015055 our Full Data Analytics Course

Data Analytics – Free Demo | Analytics Benchmark Ready to build a career in Data Analytics? Join our Free Data Analytics ...

57:50
Data Analytics – Free Demo | Analytics Benchmark📱 Call : 8374015055 our Full Data Analytics Course

71 views

5 days ago