Upload date
All time
Last hour
Today
This week
This month
This year
Type
All
Video
Channel
Playlist
Movie
Duration
Short (< 4 minutes)
Medium (4-20 minutes)
Long (> 20 minutes)
Sort by
Relevance
Rating
View count
Features
HD
Subtitles/CC
Creative Commons
3D
Live
4K
360°
VR180
HDR
375 results
In this new walkthrough, we explore how to use the blazing-fast Polars dataframe library in a Dash app, featuring a dynamic Excel ...
225 views
3 weeks ago
In this new walkthrough, we take maritime data from Excel and transform it into a Dash app featuring: - Interactive maps (latitude, ...
185 views
2 weeks ago
Dans cette vidéo, je te montre pas à pas comment créer un graphique en bougies japonaises (candlestick chart) avec Python .
37 views
4 weeks ago
dataanalytics #barcharts #plotly #plotlyexpress #pythonfordatascience In this chapter, you'll master how to create Bar Charts and ...
25 views
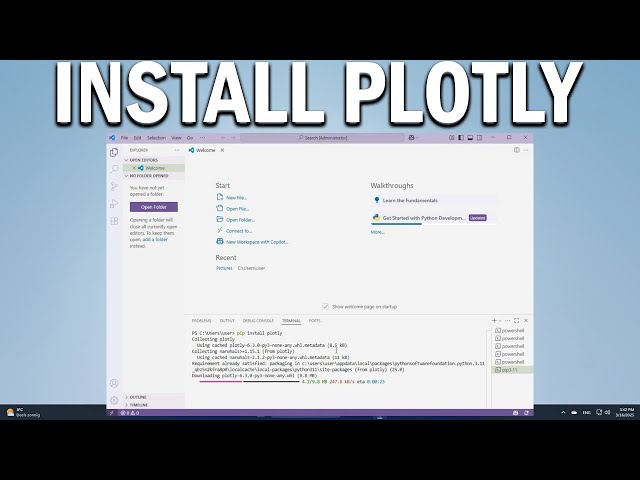
Hello Everyone! Today, in this video, I am going to step-by-step guide you on How to install Plotly with the latest Python on ...
73 views
3 days ago
Deploy your Dash apps in minutes with Plotly Cloud! Are you tired of deployment headaches on Azure, Heroku, ...
654 views
We are supporting everyone freely. Join us for live support. WhatsApp Support: ...
1,845 views
10 days ago
🚀 Learn data analysis with Python on Google Colab in 10 minutes! Use Pandas and Plotly to transform data into practical and ...
6,350 views
Build a STUNNING sales dashboard in under 10 seconds using Python & Plotly! See real-time data come alive with interactive ...
191 views
Master the art of turning data into insights with Python! In this session, you'll learn how to: Use Matplotlib & Seaborn for ...
6 views
13 days ago
How Do Matplotlib And Plotly Compare For Python Data Visualization? Are you curious about how data visualization tools can ...
0 views
Turn your marketing data into interactive dashboards with Plotly! In this video, you'll build a dynamic, interactive dashboard ...
12 days ago
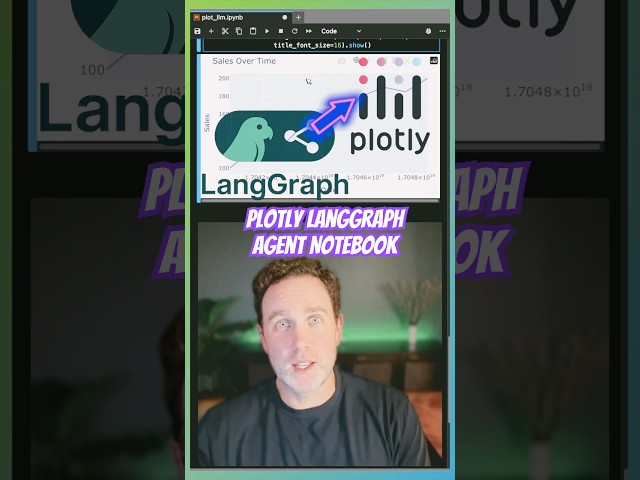
https://github.com/will-hill/Data-Science-Agents-Simplified/blob/master/001_plotly_langchain.ipynb Minimal code to create an ...
748 views
Struggling to create interactive charts and dashboards in Python? This guide shows you how to install Plotly in VS Code for ...
8 views
What Are The Differences Between Matplotlib And Plotly In Python Visualization? Are you interested in visualizing data effectively ...
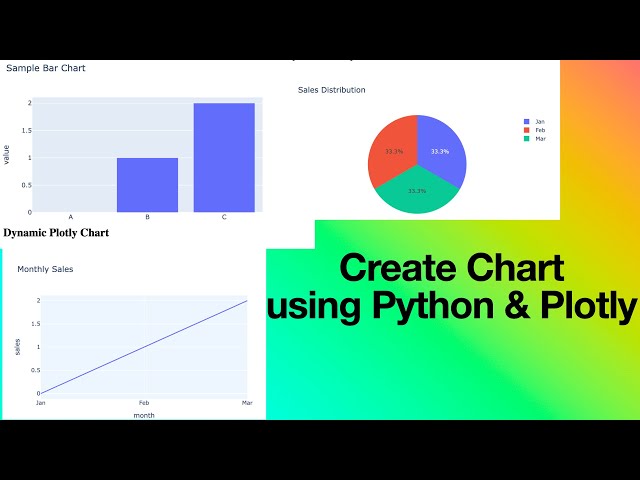
coding #python #pythonprogramming Quickly create interactive data visualizations with Python! Learn how to use Pandas and ...
1,069 views
Learn how to generate dynamic Plotly charts in Python and export them as JSON for dashboards, web apps, and data ...
How Has Python Data Visualization Evolved From Matplotlib To Plotly? Are you curious about how data visualization tools have ...
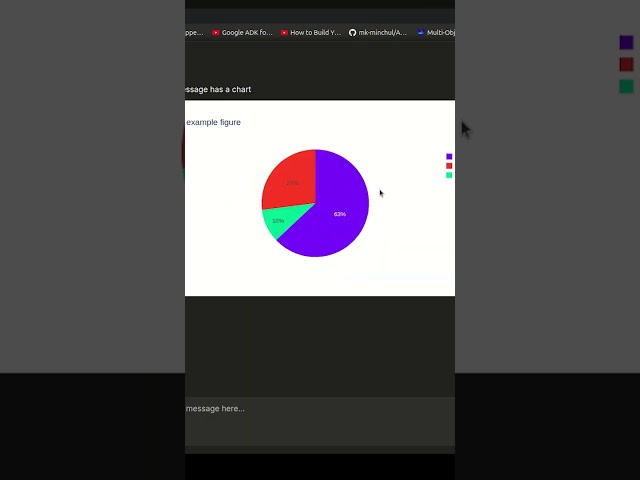
... just that's just the Python code that created the graph and such Interesting Okay So it used the library called plotly graph objects ...
362 views
Learn how to draw interactive charts in Chainlit chatbot using Plotly — all in under 30 seconds! In this quick tutorial, you'll see how ...
158 views


![How to Install Plotly with latest Python on Windows 10/11 [ 2025 Update ] Plotly Tutorial](/api/proxy/image?url=https%3A%2F%2Fi.ytimg.com%2Fvi%2FSmoaSXEZgYA%2Fsddefault.jpg)