Upload date
All time
Last hour
Today
This week
This month
This year
Type
All
Video
Channel
Playlist
Movie
Duration
Short (< 4 minutes)
Medium (4-20 minutes)
Long (> 20 minutes)
Sort by
Relevance
Rating
View count
Features
HD
Subtitles/CC
Creative Commons
3D
Live
4K
360°
VR180
HDR
197,798 results
box plot excel
excel pivot table
dot plot
scatter plot excel
box plot statistics
histogram in excel
boxplot with outliers
5 number summary
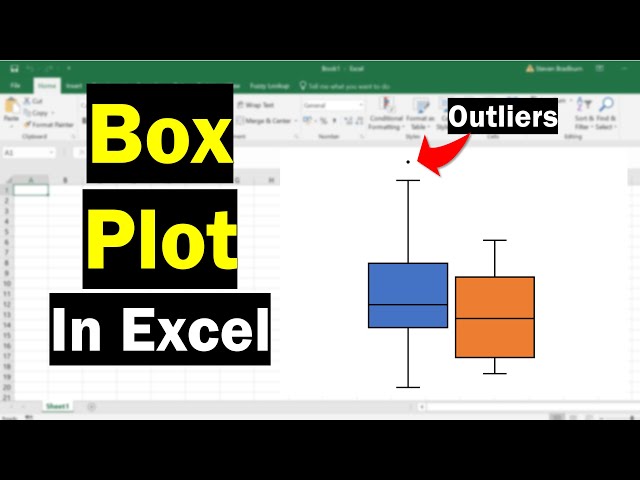
Join my newsletter https://steven-bradburn.beehiiv.com/subscribe In this tutorial, I'm going to show you how to easily create a box ...
829,013 views
4 years ago
Making a box and whisker plot (or box plot) in Microsoft office 365 - Excel 2022 takes seconds. The old complex methods are now ...
192,046 views
In this video I demonstrate how to create a boxplot using Microsoft Excel 365.
75,661 views
5 years ago
This video explains about how to create Box Plot in excel Related Videos: ...
69,323 views
This short tutorial shows how to use Microsoft Excel to correctly construct a horizontal box plot. If you want a vertical bar chart, ...
101,633 views
11 years ago
Make a box plot using raw data in Excel. You'll learn how to create a box plot in Excel from your column of data. We will also add ...
72,512 views
2 years ago
// Create and correctly interpret a box plot in Excel 2016 // Generally, a box plot graphically displays several different ...
146,999 views
7 years ago
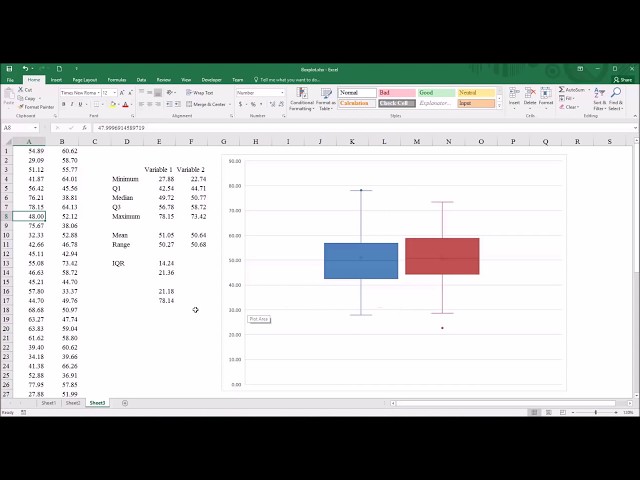
Instructional video showing how to create a side-by-side boxplot with Excel 2016. Note: this will not work with earlier versions of ...
111,912 views
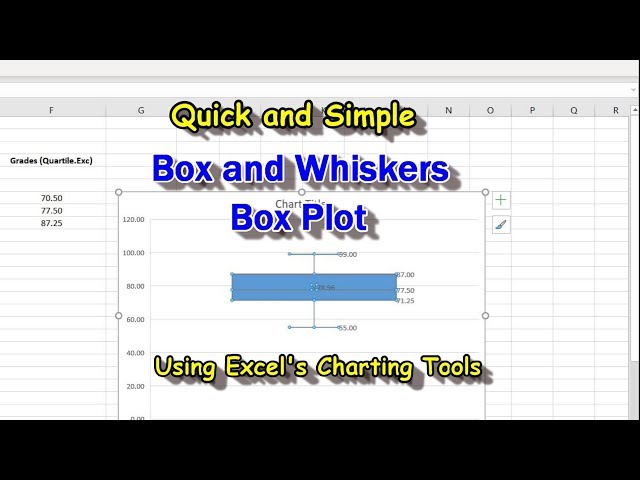
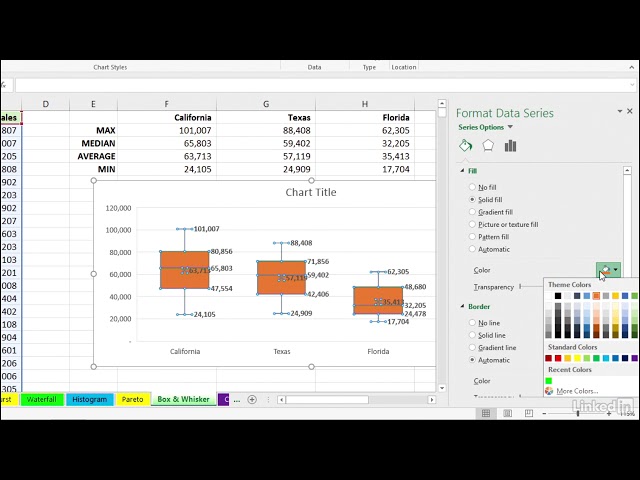
The charting tool in Excel makes creating a Boxplot very simple. It will also give you the 5 number summary: The Min, Max, and ...
36,916 views
6 years ago
This video demonstrates how to create a boxplot (box and whisker chart) using Microsoft Excel 2016. Boxplots are used to ...
843,256 views
10 years ago
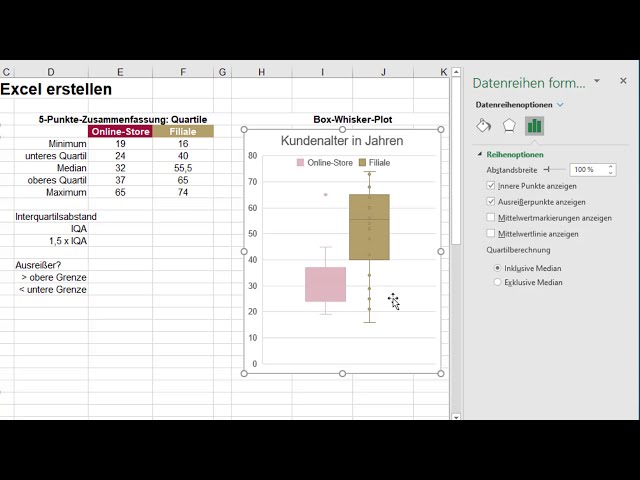
In deze video leren we een boxplot opstellen van statistische gegevens met Excel. Bovendien laat Excel het ook toe om ...
10,178 views
3 years ago
This video shows how to construct single and side-by-side box and whisker plots in Excel. Horizontal boxplot ...
22,343 views
Two examples are used to show how Insert Statistics Chart in Excel can be utilized to construct simple boxplot or comparative ...
32,167 views
This video demonstrates how to create a boxplot using Microsoft Excel. Boxplots are used to analyze the distribution of scores in ...
6,527 views
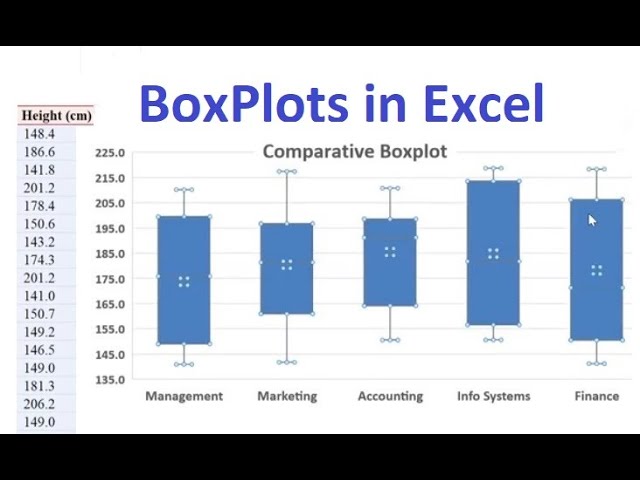
In this Excel tutorial, we'll be learning how to create categorical box plots in Excel. Box plots are a common tool used in research ...
9,267 views
In this tutorial you will learn what a boxplot is, what information can be read in a boxplot and then we will look at what we have ...
356,632 views
Quickly create boxplot charts in Excel. Excel calculates the minimum, maximum, quartile, median, mean, range, and outliers ...
2,275 views
9 months ago
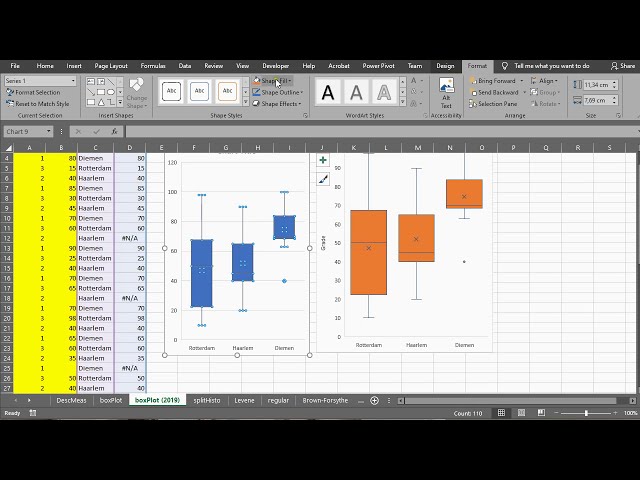
Instructional video showing how to create a side-by-side boxplot with Excel 2019. Note: this will not work with earlier versions of ...
38,929 views
BNWT05M: Einführung in die mathematischen Grundlagen In diesem Video zeige ich Dir, wie Du Minimum, Maximum, Median ...
10,689 views
Video Title: Box and Whisker chart Video File Created Date: Wednesday, April 18, 2018 (Video may or may not have been ...
2,153 views

![How to create Box Plot in excel [Simple Method]](/api/proxy/image?url=https%3A%2F%2Fi.ytimg.com%2Fvi%2FjGrJA1-lWNk%2Fsddefault.jpg)