Upload date
All time
Last hour
Today
This week
This month
This year
Type
All
Video
Channel
Playlist
Movie
Duration
Short (< 4 minutes)
Medium (4-20 minutes)
Long (> 20 minutes)
Sort by
Relevance
Rating
View count
Features
HD
Subtitles/CC
Creative Commons
3D
Live
4K
360°
VR180
HDR
2,011,351 results
scatter plot excel
boxplot excel
boxplot outliers
excel pivot table
histogram in excel
dot plot
box plot statistics
5 number summary
Join my newsletter https://steven-bradburn.beehiiv.com/subscribe In this tutorial, I'm going to show you how to easily create a box ...
829,229 views
4 years ago
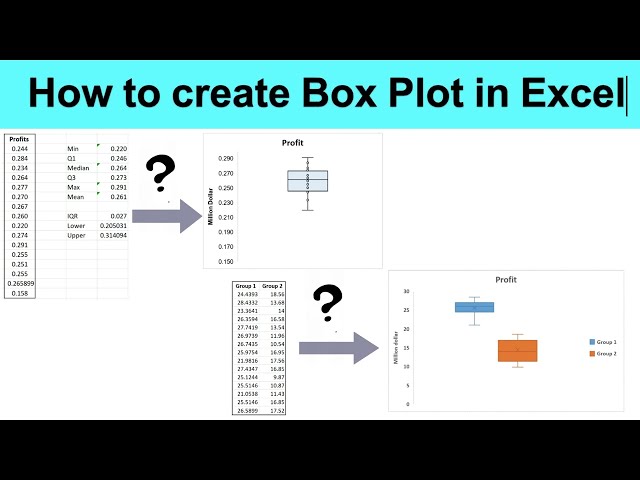
This video explains about how to create Box Plot in excel Related Videos: ...
69,377 views
Making a box and whisker plot (or box plot) in Microsoft office 365 - Excel 2022 takes seconds. The old complex methods are now ...
192,066 views
In this video I demonstrate how to create a boxplot using Microsoft Excel 365.
75,669 views
5 years ago
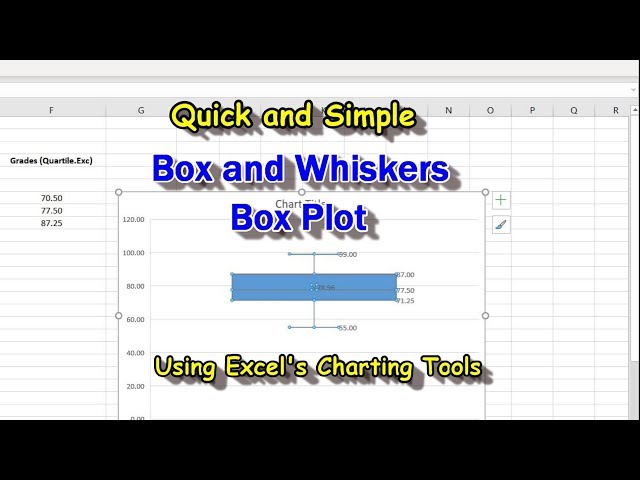
The charting tool in Excel makes creating a Boxplot very simple. It will also give you the 5 number summary: The Min, Max, and ...
36,923 views
6 years ago
This short tutorial shows how to use Microsoft Excel to correctly construct a horizontal box plot. If you want a vertical bar chart, ...
101,645 views
11 years ago
Make a box plot using raw data in Excel. You'll learn how to create a box plot in Excel from your column of data. We will also add ...
72,535 views
2 years ago
This video shows how to use Excel to conduct a Hypothesis test of two samples to determine if they are statistically, signficantly ...
175 views
6 months ago
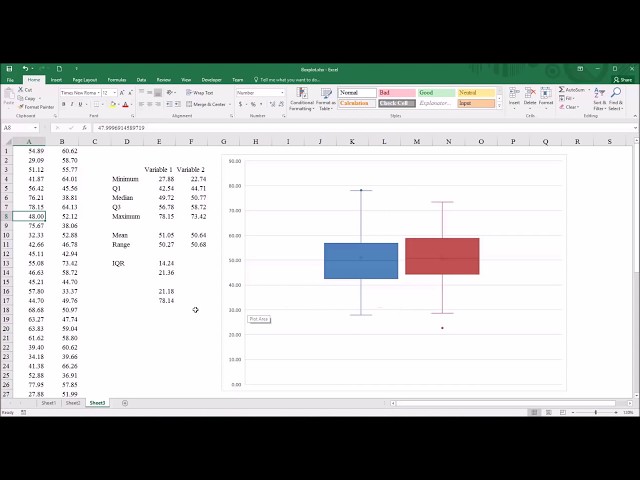
This video demonstrates how to use the interquartile range (IQR) and boxplots to detect outliers and compare two variables using ...
36,831 views
9 years ago
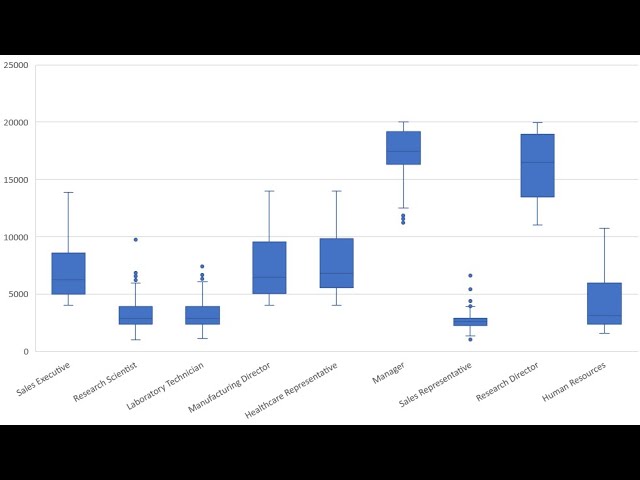
Foreign I'm going to show you how to create a comparative box plot for data in Excel so let's go to excel now in a data set I ...
20,940 views
In this tutorial, you will learn How to Create a Group Box Plot in Excel. Software Version : Excel 2016 A box and whisker plot, also ...
12,988 views
1 year ago
Box and whisker charts are something that is easy to create in Excel if you've got version 2016 or higher. There's the option to ...
16,826 views
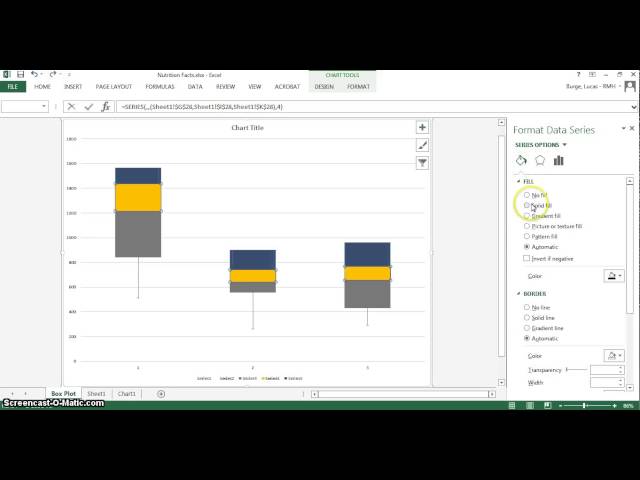
... set up there next what Excel really needs to do it doesn't just make box plots we got to kind of manipulate some stacked graphs ...
82,459 views
10 years ago
Oh okay my friends let's take a look at how to make a side-by-side series of box plots here uh with the democrats versus the ...
10,609 views
// Create a box plot in Excel (up to version 2013) // A box plot chart cannot be easily created in Excel because this ...
64,343 views
8 years ago
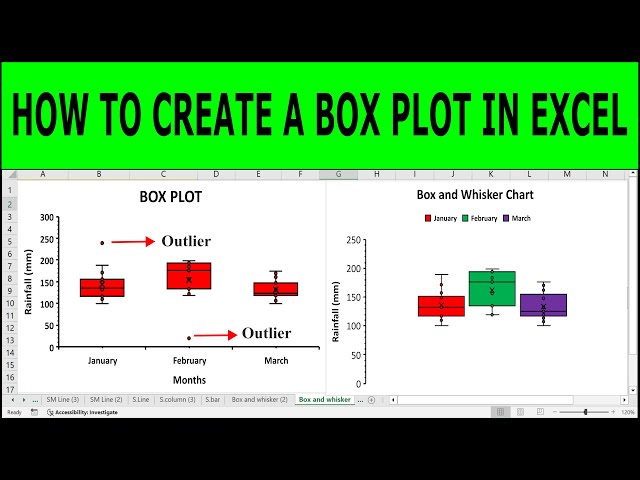
In this video, you will learn how to create a Box Plot or Box and Whisker plot in Microsoft excel easily. Additionally, you will also ...
25,377 views
Representation by a simple example a five-number summary (the smallest value, the first quartile, the median, the third quartile, ...
35,835 views
This video demonstrates how to create a boxplot (box and whisker chart) using Microsoft Excel 2016. Boxplots are used to ...
843,263 views
Instructional video showing how to create a side-by-side boxplot with Excel 2016. Note: this will not work with earlier versions of ...
111,914 views
7 years ago
In this video, you will learn How to Create a Box Plot in Excel (With Outliers and Mean Values) or how to create a Box and Whisker ...
13,007 views
// Create and correctly interpret a box plot in Excel 2016 // Generally, a box plot graphically displays several different ...
147,018 views
This video shows how to convert the vertical boxplot generated by Microsoft Excel to a horizontal boxplot in PowerPoint.
18,815 views
Create a Box Plot in Excel – Including Outliers! #excel In this tutorial, you'll learn how to create a box plot in Excel and identify ...
156 views
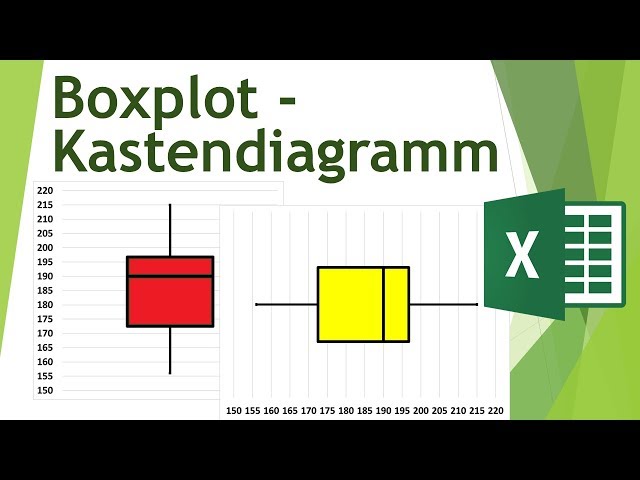
In this tutorial you will learn what a boxplot is, what information can be read in a boxplot and then we will look at what we have ...
356,705 views
3 years ago
In this video I go over all the steps to create a box plot visual in Power BI without having to rely on any custom visual. It captures ...
66,834 views
This video demonstrates how to create a boxplot using Microsoft Excel. Boxplots are used to analyze the distribution of scores in ...
6,527 views
Creating a Box Plot Chart in Excel 2016.
24,195 views
Step by step instructions on how to create a Box and Whisker Plot in Excel 2010. Note: This method doesn't work if the min, max, ...
513,378 views
13 years ago
We cover how to make a simple box plot in excel. A box plot is a type of chart which shows the spread and centres of a dataset ...
598 views
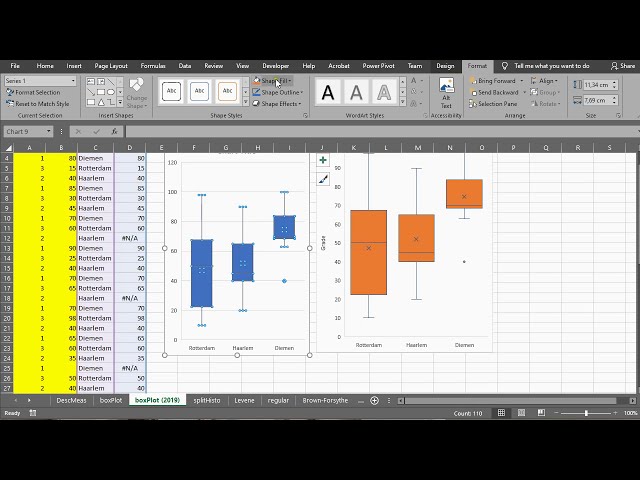
Instructional video showing how to create a side-by-side boxplot with Excel 2019. Note: this will not work with earlier versions of ...
38,937 views
![How to create Box Plot in excel [Simple Method]](/api/proxy/image?url=https%3A%2F%2Fi.ytimg.com%2Fvi%2FjGrJA1-lWNk%2Fsddefault.jpg)