Upload date
All time
Last hour
Today
This week
This month
This year
Type
All
Video
Channel
Playlist
Movie
Duration
Short (< 4 minutes)
Medium (4-20 minutes)
Long (> 20 minutes)
Sort by
Relevance
Rating
View count
Features
HD
Subtitles/CC
Creative Commons
3D
Live
4K
360°
VR180
HDR
34,314 results
Building a data visualization with Bokeh involves the following steps: 1. Prepare the data 2. Determine where the visualization will ...
4,282 views
6 years ago
Today we learn how to create professional interactive web visualizations with Bokeh in Python.
42,195 views
2 years ago
Learn how to create interactive and complex visualizations using Plotly and Bokeh libraries in Python. Music credits: Lost In ...
779 views
In this video Rob, a Kaggle Grandmaster, quickly and humorously walks through each of the popular plotting and data ...
106,444 views
3 years ago
Tired of Matplotlib's outdated approach? Discover these 5 powerful Python libraries that offer cleaner, more intuitive, and often ...
7,024 views
1 year ago
Data Scientist Masters Program (Discount Code - YTBE15) ...
19,163 views
4 years ago
In this video tutorial , you will learn how to visualize the stock prices for Apple, Facebook, Google and Microsoft using Bokeh ...
3,033 views
5 years ago
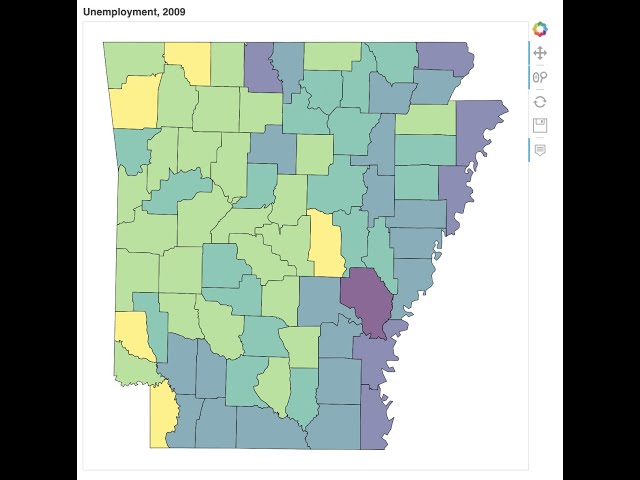
Bokeh supports creating map-based visualizations and working with geographical data.
1,458 views
"Speaker: Chalmer Lowe Bokeh is a powerful data visualization library that creates fully interactive plots and integrates well with ...
9,931 views
8 years ago
This talk largely follows a technical blog post by the same author. First, and because my company (ASML) has not been ...
4,372 views
Get a look at our course on data science and AI here: https://bit.ly/3thtoUJ ...
1,005 views
Bokeh looks promising for my data visualization projects. Animation can be achieved by updating the data source on the server ...
4,439 views
9 years ago
This video about history visualization covid 19 from 22 january - 30 Agustus 2021 using Bokeh. In you wonder how to create this ...
505 views
This is video 10 of our series on scraping data to storing it to visualizing it. In this clip, we take our data we scraped from Craigslist ...
6,743 views
You can see the column data source with the standard Python like dictionaries pandas dataframes lists or non P arrays but using ...
423 views
7 years ago
This is the second example. This time the circles have purposeful, predictable movement. You can view the code in this example ...
1,428 views
Bokeh is a data visualization library that lets Python programmers and data scientists create interactive, novel, plots for the web.
33,088 views
11 years ago
In this video, you will learn how to use the Bokeh library for creating interactive visualizations on the browser. The tutorial assumes ...
60,001 views
bokeh #python #interactivechart #scatterplot.
276 views
SF Python Meetup April 8, 2020 Learn about interactive data visualizations using Bokeh (in Python) with Chris Brousseau, ...
2,726 views