ViewTube

ViewTube
Sign inSign upSubscriptions
Filters

Upload date

Type

Duration

Sort by

Features

Reset

624 results

Durga Software Solutions
📊 How Python Helps in Data Visualization | Learn Charts & Graphs Easily | DURGASOFT

Data looks confusing? Turn it into simple charts with Python! Learn how to visualize your data with Matplotlib, Seaborn, and more.

0:26
📊 How Python Helps in Data Visualization | Learn Charts & Graphs Easily | DURGASOFT

283 views

1 day ago

Coursera
6 Python Libraries for Data Science

Python Libraries For Data Science Pandas → Data cleaning & manipulation NumPy → Fast math & arrays Matplotlib → Basic ...

0:08
6 Python Libraries for Data Science

1,556 views

2 days ago

Charles Niswander
Python Data Science Toolkit

You wouldn't wander into a jungle without a backpack, and you shouldn't start a data project without the right toolkit. 🛠️ In ...

1:57
Python Data Science Toolkit

0 views

5 days ago

Plotivy
Plotivy is a modern, AI-assisted platform designed specifically for scientific data visualization

Plotivy is a modern, AI-assisted platform designed specifically for scientific data visualization and image analysis. Built by an ...

0:34
Plotivy is a modern, AI-assisted platform designed specifically for scientific data visualization

0 views

6 days ago

Jeevitha Ramsudha
Seaborn Bar Plot Tutorial | Easy & Beginner Friendly

In this video, you'll learn how to create Bar Plots using Seaborn to visualize categorical data with ease. Perfect for Data Science, ...

3:40
Seaborn Bar Plot Tutorial | Easy & Beginner Friendly

0 views

6 days ago

P_for_{programming}
Python data visualisation library#seaborn #histogram #datascience
0:06
Python data visualisation library#seaborn #histogram #datascience

149 views

6 days ago

Battle Charts
Most Popular Programming Languages 1958 - 2025

This video is a data visualization that presents a detailed timeline of the most popular programming languages from 1958 up to ...

3:10
Most Popular Programming Languages 1958 - 2025

30 views

6 days ago

Luna Knowz
Implementation of K Means Clustering for Customer Segmentation

In this video, we implement K-Means Clustering for Customer Segmentation using Python. You will learn how to load data, apply ...

3:16
Implementation of K Means Clustering for Customer Segmentation

16 views

6 days ago

Colorstech Training (By Slidescope)
Top 5 Skills for Data Analyst Jobs in 2026

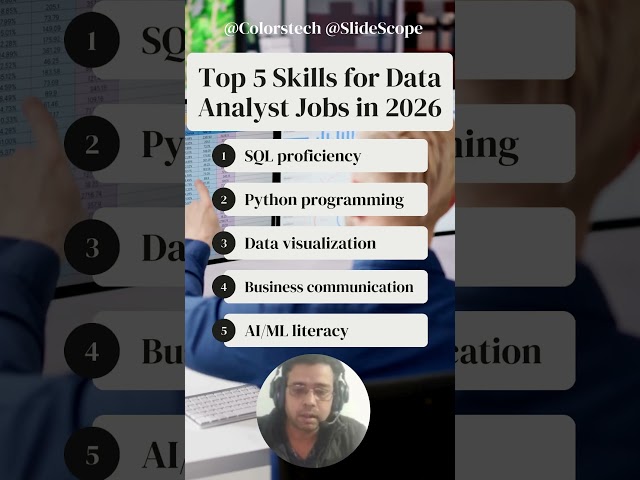
dataanalytics #careertips #datavisualization #datanalystjobs #becomedataanalyst SQL proficiency: Core for querying and ...

0:53
Top 5 Skills for Data Analyst Jobs in 2026

133 views

14 hours ago

Aadity Kush X Code
What is Data Visualization | Simplest Explanation with Real-Life Examples

What is Data Visualization | Simplest Explanation with Real-Life Examples What is Data Visualization? In this video, we'll ...

0:56
What is Data Visualization | Simplest Explanation with Real-Life Examples

0 views

6 days ago

Jeevitha Ramsudha
Scatter plot explained simply | Seaborn Tutorial

Learn Scatter Plots in the simplest way! In this video, you'll understand what a scatter plot is, why we use it, and how to create one ...

3:36
Scatter plot explained simply | Seaborn Tutorial

0 views

5 days ago

Eldar Mammadov Ilham
Matplotlib plt.show() Explained with Anscombe’s Quartet (Beginner Friendly)

In this video, we explore the basics of plt.show() in Matplotlib using the legendary Anscombe's Quartet (anscombe dataset) from ...

0:36
Matplotlib plt.show() Explained with Anscombe’s Quartet (Beginner Friendly)

0 views

5 days ago

Hafiz Muhammad Naveed
Hierarchical Clustering Tutorial on the Iris Dataset | Dendrogram, Visualization & Cluster Analysis

Welcome to Python Projects for Everyone! On this channel, we learn Python step by step through real-world examples — in a ...

1:56
Hierarchical Clustering Tutorial on the Iris Dataset | Dendrogram, Visualization & Cluster Analysis

1 view

6 days ago

The Debug Zone
How to Save Fullscreen Figures in Matplotlib: A Step-by-Step Guide

Related to: #matplotlib, #savefullscreenfigures, #matplotlibtutorial, #datavisualization, #pythonplotting, #step-by-stepguide, ...

2:42
How to Save Fullscreen Figures in Matplotlib: A Step-by-Step Guide

0 views

6 days ago

Chilling 101
How to Learn Data Science Step by Step (updated)

How to Learn Data Science Step by Step (updated) | Surfshark VPN Deal — Stay private and secure. $1.99/mo + 3 Months ...

1:40
How to Learn Data Science Step by Step (updated)

0 views

7 days ago

Mr. BioinformatiX
Python Trick | Python for Bioinformatics | Bioinformatics for Beginners

python #pythontricks #bioinformatics #mrbioinformatix #bioinformaticsforbeginners #pythonforbioinformatics #mrbioinformatix ...

0:22
Python Trick | Python for Bioinformatics | Bioinformatics for Beginners

1,088 views

3 days ago

Jeevitha Ramsudha
Learn Heatmaps in the simplest way!

In this video, you'll understand what a heatmap is, why it's used, and how to create one using Seaborn and Matplotlib. What ...

3:33
Learn Heatmaps in the simplest way!

0 views

5 days ago

Kunusoft
Unsupervised Learning: K-Means & KNN in Action! ⚡ #machinelearning #python #shorts

In this video, we dive into unsupervised learning with k-means clustering . We explore how to create and visualize data, classify ...

0:41
Unsupervised Learning: K-Means & KNN in Action! ⚡ #machinelearning #python #shorts

88 views

6 days ago

Durga Software Solutions
📊 Why Python is a Must for Data Analysts | Learn Data Analytics Skills | DURGASOFT

Want to become a Data Analyst? Python helps you analyze, visualize, and present data like a pro! Learn practical skills ...

0:26
📊 Why Python is a Must for Data Analysts | Learn Data Analytics Skills | DURGASOFT

180 views

5 days ago

DataCode With Sharad
t-SNE Tutorial for Beginners  High-Dimensional Data Visualization in Machine Learning

#tSNE #MachineLearning #DimensionalityReduction #DataScience #Visualization #DeepLearning #Python #ScikitLearn ...

3:24
t-SNE Tutorial for Beginners High-Dimensional Data Visualization in Machine Learning

16 views

5 days ago

Docspark
AI Workflow – Ads Performance Prediction & Auto-Reporting

This project is a complete Python workflow, developed in Google Colab, to help marketing teams predict ad campaign ...

0:30
AI Workflow – Ads Performance Prediction & Auto-Reporting

0 views

5 days ago

Octopus Tentacles
DataCamp Python  R Programming Pricing Explained  What You Get for Your Money

DataCamp Python R Programming Pricing Explained What You Get for Your Money nan.

2:17
DataCamp Python R Programming Pricing Explained What You Get for Your Money

0 views

7 days ago

Touseef Shaik
Python  The Ultimate Toolkit for AI and Data Science video export 2025 11 18T06 26 20 632Z
0:30
Python The Ultimate Toolkit for AI and Data Science video export 2025 11 18T06 26 20 632Z

0 views

5 days ago

RADHIKA'S CODE HUB
#Data Visualization #Matplotlib #plotly #Seaborn #coding Bokeh  #coding #python #interviewprep #tech

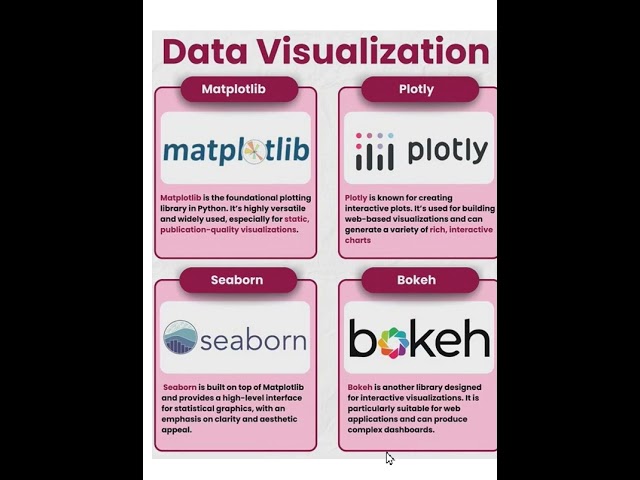
Data Visualization #Matplotlib #plotly #Seaborn #coding Bokeh #coding #python #interviewprep ...

0:32
#Data Visualization #Matplotlib #plotly #Seaborn #coding Bokeh #coding #python #interviewprep #tech

8 views

6 days ago

Future Coding Stars
9. Data Analysis with GitHub Copilot: Clean, Transform & Visualize Data #githubcopilot #copilot #ai

GitHub Copilot: Data Analysis with GitHub Copilot: Clean, Transform & Visualize Data Are you a Future Coding Star looking to ...

3:46
9. Data Analysis with GitHub Copilot: Clean, Transform & Visualize Data #githubcopilot #copilot #ai

25 views

5 days ago