Upload date
All time
Last hour
Today
This week
This month
This year
Type
All
Video
Channel
Playlist
Movie
Duration
Short (< 4 minutes)
Medium (4-20 minutes)
Long (> 20 minutes)
Sort by
Relevance
Rating
View count
Features
HD
Subtitles/CC
Creative Commons
3D
Live
4K
360°
VR180
HDR
36,895 results
Unleash the power of data with our quick rundown of the "Top 3 Python Libraries for Stunning Data Visuals!" ✨ In this video, we ...
608 views
6 months ago
Explore All My Excel Solutions: https://pythonandvba.com/solutions DESCRIPTION ...
8,740 views
2 years ago
Matplotlib vs Seaborn vs Plotly: Best Python Visualization Tools.
2,145 views
1 month ago
2,845 views
11 months ago
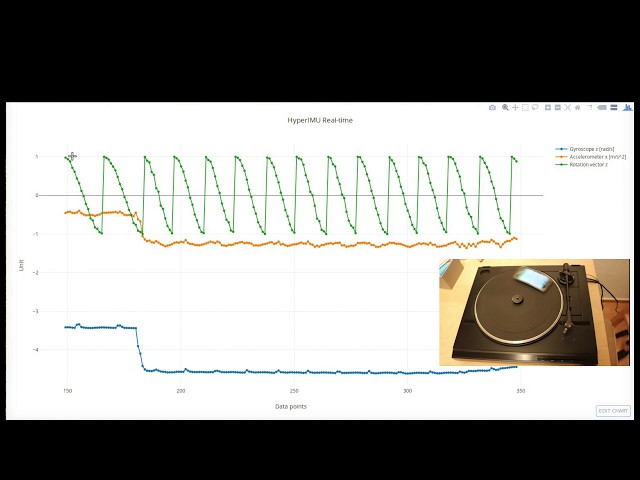
A demo of live streaming data to plotly API with Python. Android sensor data are streamed with the AndroidApp HyperIMU.
1,349 views
8 years ago
Watch till last for a detailed description ✍️ ✌️ ENROLL in My Highest ...
6,047 views
5 years ago
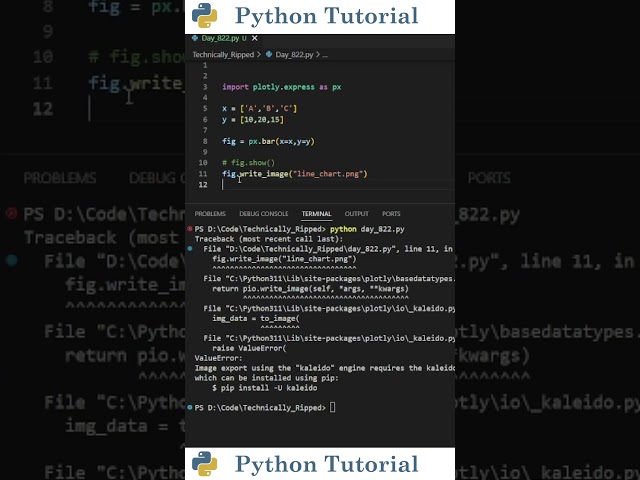
Learn two easy ways to save your Plotly charts as image files in Python! Use write_image() with the Kaleido library, or take a ...
5,796 views
3 months ago
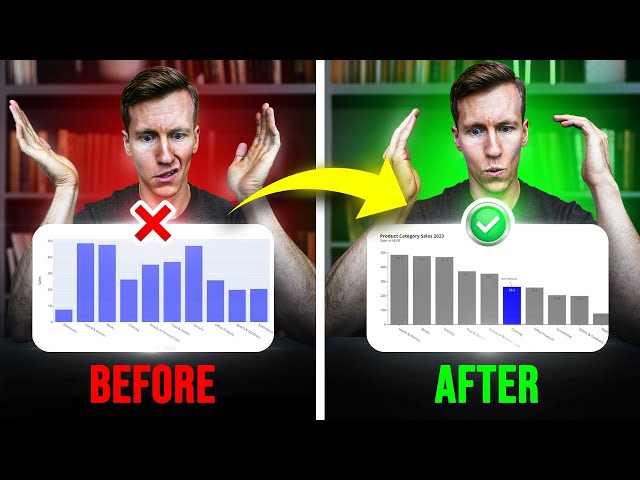
Watch as I compare plotting the same line chart in Matplotlib and Plotly. One gives you a clean, static image while the other offers ...
1,328 views
Join our community project to practice and build your Python, Plotly, and AI skills alongside supportive community members.
878 views
10 months ago
In this tutorial, you'll learn how to add a moving average line to your Plotly line charts using Python. This is perfect for analyzing ...
1,380 views
4 months ago
How To Install Plotly For Python In VS Code Plotly is a powerful graphing library that helps Python users create interactive ...
277 views
5 months ago
Plotly is a data visualization library that allows users to create interactive plots, charts, and graphs. It is available in several ...
724 views
173 views
Learn how to create insightful and interactive box plots using Python and Plotly! With these simple steps, you can visualize your ...
507 views
1 year ago
YouTube Video Description Welcome to another exciting data visualization tutorial on DataViz! In this video, we dive into ...
423 views
7 months ago
Learn how to create interactive and complex visualizations using Plotly and Bokeh libraries in Python. Music credits: Lost In ...
779 views
How to do a Scatter Plot with Python - This is a tutorial video in a series of short videos of Data Visualization with Python.
434 views
In this video tutorial, we will explore how to create a 3D scatter plot using Python Plotly. A scatter plot is a popular data ...
466 views
In this tutorial, you'll learn how to create a horizontal bar chart using Plotly Express in Python. Horizontal bar charts are great for ...
1,413 views
Multipage app with side panel in python by plotly dash. View live this application. https://kpi-sales-dashboard.herokuapp.com/ ...
5,057 views