Upload date
All time
Last hour
Today
This week
This month
This year
Type
All
Video
Channel
Playlist
Movie
Duration
Short (< 4 minutes)
Medium (4-20 minutes)
Long (> 20 minutes)
Sort by
Relevance
Rating
View count
Features
HD
Subtitles/CC
Creative Commons
3D
Live
4K
360°
VR180
HDR
393 results
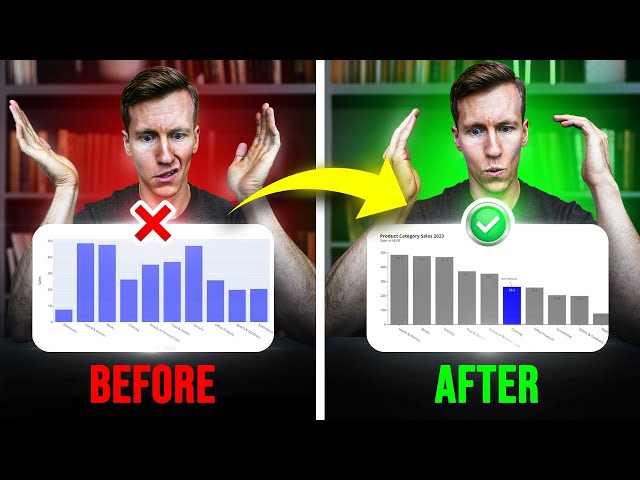
Explore All My Excel Solutions: https://pythonandvba.com/solutions DESCRIPTION ...
8,741 views
2 years ago
2,845 views
11 months ago
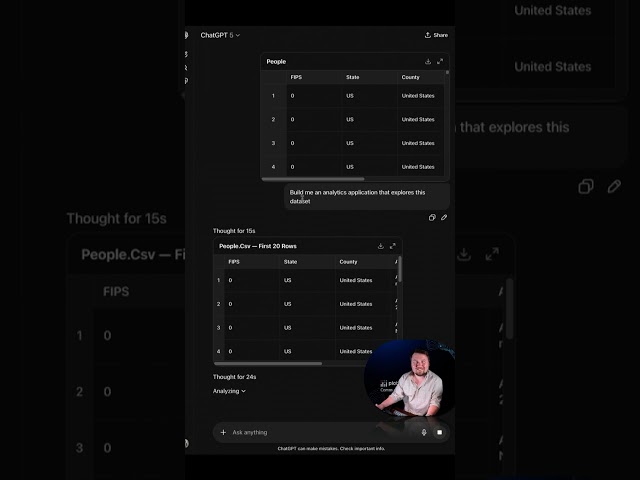
Can general-purpose AI like OpenAI's ChatGPT build better Dash apps than Plotly Studio? We put them head-to-head: • Dropped ...
1,551 views
2 months ago
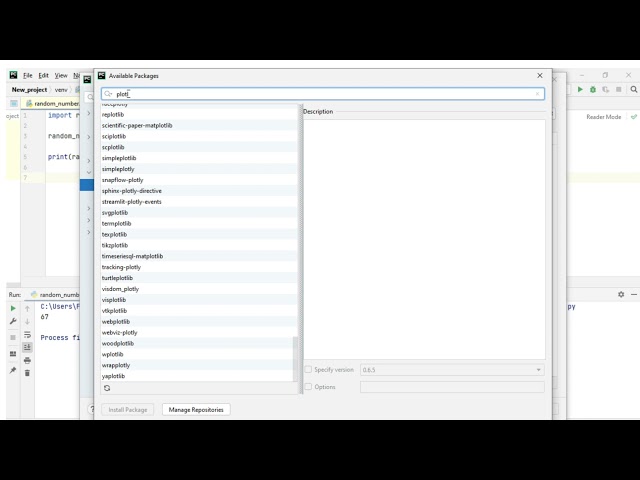
How to Install Plotly on PyCharm ✓ Subscribe To My YouTube Channel: ...
2,892 views
4 years ago
Deploy your Dash apps in minutes with Plotly Cloud! Are you tired of deployment headaches on Azure, Heroku, ...
654 views
2 weeks ago
Playlist: https://www.youtube.com/playlist?list=PLNmsVeXQZj7pb4apqIMKvCz37t_dLznMm ❤❤❤ Early access to tutorials, polls, live ...
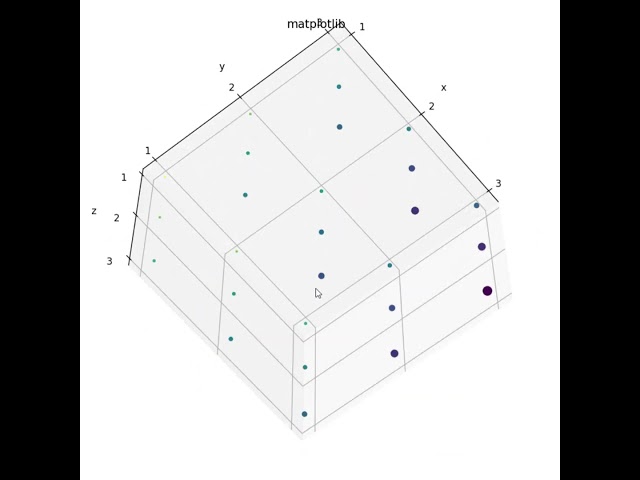
2,726 views
You can export 3D plots as html files in a lossless manner using Plotly.
421 views
1 year ago
This video is part of an online course, Data Visualization and D3.js. Check out the course here: ...
4,597 views
10 years ago
Plotting is essential to exploring data but 3D plotting in Jupyter can be a pain. Learn how to fix that! Resources: Notebook from ...
29 views
3 years ago
Tutorial on How to plot Stock Candlestick Chart with 2 lines of Code in Python. In this video we will use plotly module (package) in ...
1,067 views
Have a pile of data that you need to make sense of? Take a look at this DIY Tryin Extra! Sample code: ...
9,424 views
11 years ago
RStudio 2024.12.0 R 4.4.2 data.table 1.16.4 dplyr 1.1.4 plotly 4.10.4 Previous video: ...
45 views
9 months ago
The hvplot library has a new .inspect() method that lets you interactively plot million- and billion-point datasets. Credit to Jean-Luc ...
1,198 views
Python is arguably the world's most popular programming language. It is easy to learn, yet suitable in professional software like ...
289 views
In this video, we will look at Plotly 'choropleth' map. Plotly 'choropleth' map is an outline based map. All metadata associated with ...
106 views
7,003 views
Matplotlib python #short #tutorial - on basics of creating a Stacked Bar Chart which is best suited for displaying multiple sets of ...
486 views
Lightning talk on the Vega-Altair Python visualization library, presented by Jon Mease for SciPy 2023 Twitter: @jonmmease ...
1,511 views
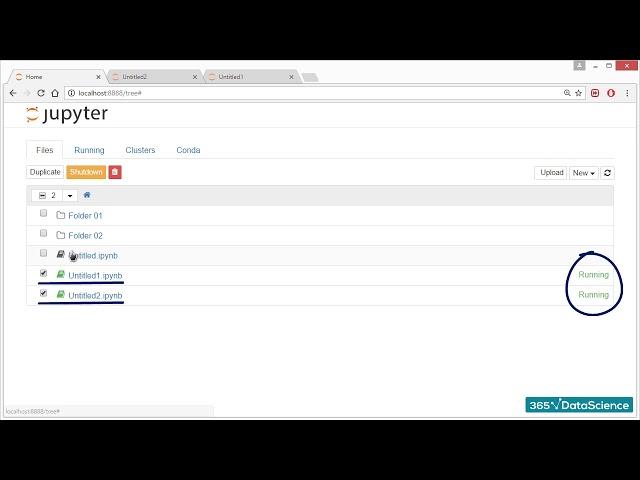
When you create a new Python notebook file, it will be recorded in the IPython Notebook format, dot ipynb for brief. Don't fear this ...
404 views
7 years ago
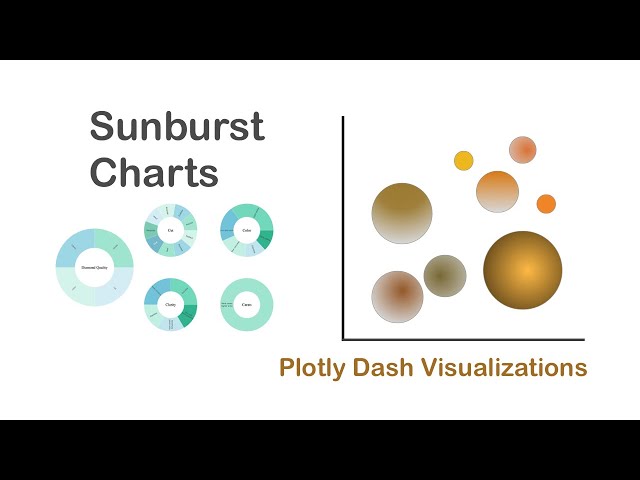
Introduction: A sunburst chart is suitable when there is hierarchical data to be presented visually. The data for the sunburst chart ...
211 views
Eid Mohammad Python Django, Flask, and Dash Plotly Developer Welcome to my YouTube channel! I'm Eid Mohammad, and I'm ...
10 views
I am happy to announce the release of streamlit-echarts version 0.4.0 In this video, I will very quickly present you its newest ...
5,707 views
Welcome to DataViz Globe! I'm Sithembiso, a software developer from South Africa, and I'm starting an exciting journey to make ...
78 views
1 month ago
Nesse vídeo, eu te ensino a fazer um histograma no Python utilizando a biblioteca Plotly. Pro vídeo ficar mais divertido, eu vou ...
644 views
It's finally released! Get it here: https://100daysofpython.dev/ 100 days, 1 hour per day, learn to build 1 project per day, this is how ...
103,414 views
5 years ago