Upload date
All time
Last hour
Today
This week
This month
This year
Type
All
Video
Channel
Playlist
Movie
Duration
Short (< 4 minutes)
Medium (4-20 minutes)
Long (> 20 minutes)
Sort by
Relevance
Rating
View count
Features
HD
Subtitles/CC
Creative Commons
3D
Live
4K
360°
VR180
HDR
4,944 results
Welcome to our comprehensive tutorial on **Python PANDAS for Beginners**! In this video, we will dive into the powerful world of ...
79,545 views
1 year ago
Dive into the world of data visualization with this comprehensive guide to mastering Matplotlib in Python! In this tutorial, we'll ...
56 views
2 years ago
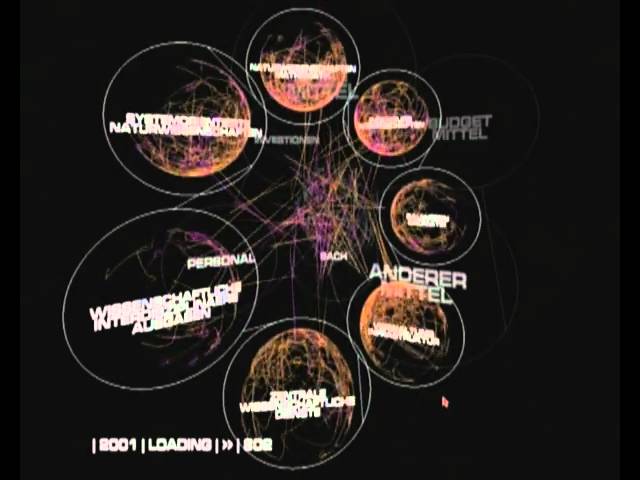
A 3D data visualization of the financial flows at the ETH-Zurich university. Developed back in 2003 for an immersive virtual reality ...
1,233 views
13 years ago
In this quick tip, learn how to import the matplotlib library and create plots to visualize data analysis and machine learning training ...
184 views
1 month ago
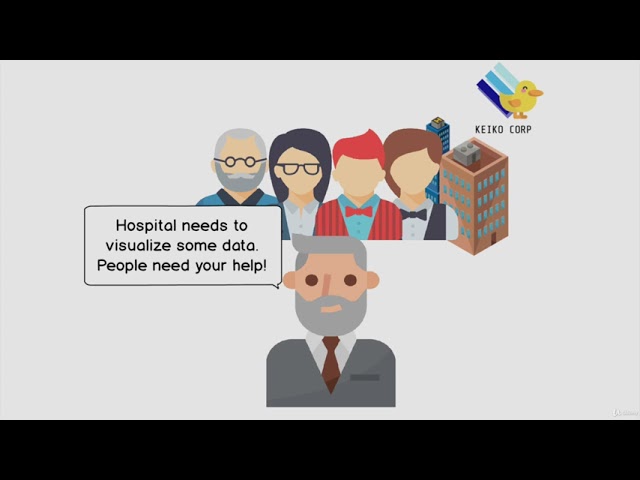
What is Data Visualization ?
60 views
Get this course for free: Fundamental Data Analysis and Visualization Tools in Python: https://bit.ly/3kFOAPD Learn the ...
65 views
5 years ago
Did you know you can use the pandas Python library inside Microsoft Excel to conduct advanced statistical modeling? Watch here ...
38,043 views
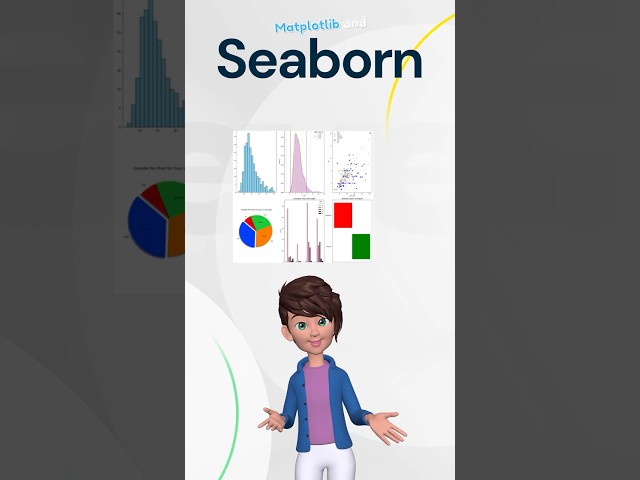
In this video, we dive deep into the world of data visualization in Python using three powerful libraries: Matplotlib, Seaborn, and ...
958 views
Do you need to learn SQL if you can do everything in Python? #python #dataanalysis #SQL. SUBSCRIBE! Do you want to ...
68,250 views
The Matplotlib figure canvas renderer can be confusing to wrestle with if you don't know how it actually works. By the end of this ...
3,489 views
4 weeks ago
Welcome to this Python project tutorial where we dive into the fascinating world of data visualization! In this video, we will guide ...
5 views
Did you hear that Python in Excel has launched? This new integration between Anaconda and Microsoft Excel brings Python to ...
6,880 views
3 views
4 years ago
Overview of lesson covering visualization with pandas and Matplotlib.
40 views
3 years ago
74 views
6 years ago
PythonLibraries #DataScienceEssentials #TechTuesday #DataScienceTools #DataAnalysis #DeepLearning #WebScraping ...
39 views
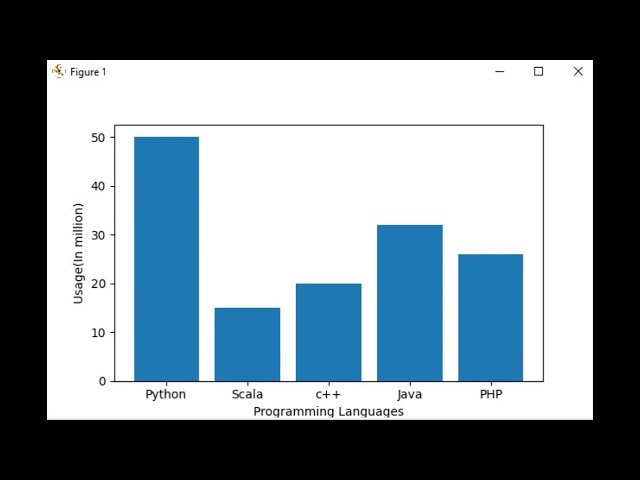
In this video, we'll dive into the world of data visualization using Matplotlib, one of the most popular libraries in Python. Specifically ...
2 views
10 months ago
The code is a mess :S https://github.com/FranMartiarena/Path-Finder.
243 views
This animation illustrates the solution to day 1 problem of Advent of Code 2023. We need to scan a list of strings and find numbers ...
102 views
In this video, we'll explore the powerful capabilities of PyQtGraph, a popular library for creating interactive and real-time plots in ...
46 views
3 months ago


![Don’t Train Without This Step! Visualize Your Data in Python [3]](/api/proxy/image?url=https%3A%2F%2Fi.ytimg.com%2Fvi%2FLEQAxM_qeM4%2Fsddefault.jpg)