Upload date
All time
Last hour
Today
This week
This month
This year
Type
All
Video
Channel
Playlist
Movie
Duration
Short (< 4 minutes)
Medium (4-20 minutes)
Long (> 20 minutes)
Sort by
Relevance
Rating
View count
Features
HD
Subtitles/CC
Creative Commons
3D
Live
4K
360°
VR180
HDR
75,409 results
Colab Notebook: https://colab.research.google.com/drive/1wxI23X7EzV2-DlWU7F0iIeTSTV2OPYTy?usp=sharing Thank you for ...
35,423 views
3 years ago
Learn the quickest way to build a Python Dashboard with ChatGPT Plotly and Dash. We'll show you two separate dashboards, ...
74,470 views
2 years ago
In this video Rob, a Kaggle Grandmaster, quickly and humorously walks through each of the popular plotting and data ...
106,445 views
Tired of Matplotlib's outdated approach? Discover these 5 powerful Python libraries that offer cleaner, more intuitive, and often ...
7,026 views
1 year ago
В уроке мы научимся визуализировать данные при помощи библиотек Plotly и Dash. За счет этих библиотек вы можете ...
5,270 views
In this Plotly Express tutorial, we'll show you how to use Plotly to create professional graphs in minutes! GitHub Link: ...
10,685 views
Fala, pessoal! Esse é o primeiro vídeo de uma série sobre o Plotly, uma biblioteca do Python de plotagem interativa e de código ...
16,436 views
4 years ago
Data visualization is an import part of working with data and Python has many libraries that allow you to display a wide range of ...
7,959 views
"In this tutorial I describe the all important process of creating more than one plot in a single figure. Plots can be placed on a grid ...
199 views
Here are some resources that have helped me: 1. Docs - https://plotly.com/python/getting-started/ 2. Great github repo ...
15,725 views
Mastering Interactive Data Visualization with Plotly in Python | Build Stunning Charts for Business Dashboards Want to turn ...
171 views
4 months ago
This is a First introductory plotly tutorial video of plotly data visualization in python with real data, I have talked about how you can ...
39,368 views
7 years ago
Data visualization is an important part of working with data and Python has many libraries that allow you to display a wide range of ...
11,354 views
Data Used: https://www.nasdaq.com/market-activity/stocks/aapl/historical Google Colab Link: https://colab.research.google.com/ ...
8,180 views
Create a multi page app in Python using Plotly Dash. This is an introduction to multi-page Python Apps, focused on getting you ...
30,368 views
Explore All My Excel Solutions: https://pythonandvba.com/solutions DESCRIPTION ...
11,974 views
5 years ago
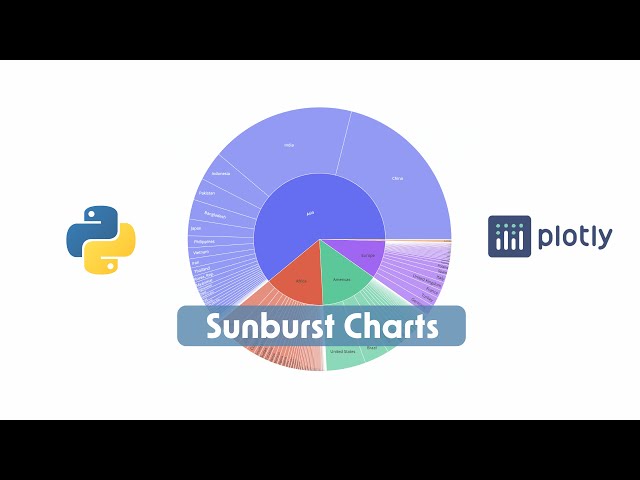
This tutorial is an introduction to Sunburst charts on Plotly Express. Plotly Express is a data visualizaiton library in Python that ...
1,813 views
Watch this 12min practical Plotly Dash tutorial with community member, Jesús, to learn how to create Python data apps, following ...
9,591 views
Learn to build an interactive app with matplotlib graphs, dropdowns and tables with Plotly Dash.
15,270 views
5,385 views
Install Plotly and start working with it. The video explains Plotly and various plots like scatter, bar, and pie charts with Plotly that ...
812 views
Today you will learn how to create candlestick stock charts with plotly. We will include moving average terms within our ...
19,369 views
Python #CandleStickChart #Stocks How To Make Interactive Candlestick Charts Using Plotly & Python ⭐Please Subscribe !
36,481 views
In this video, learn how to install Plotly Python library. We will also install Python and pip. Pip is used to install and manage ...
9,006 views
Want to build **interactive dashboards** right inside your **Jupyter Notebook**? In this video, you'll learn how to create powerful, ...
4,196 views
7 months ago


![📈 How To Create A Candlestick Chart In Python Using Plotly | Tutorial [EASY]](/api/proxy/image?url=https%3A%2F%2Fi.ytimg.com%2Fvi%2Fc1zwV8x-zK4%2Fsddefault.jpg)


![How To Create A Waterfall Chart In Python Using Plotly & Excel | Tutorial [EASY] 💻](/api/proxy/image?url=https%3A%2F%2Fi.ytimg.com%2Fvi%2FTQWwaLqtpq4%2Fsddefault.jpg)