Upload date
All time
Last hour
Today
This week
This month
This year
Type
All
Video
Channel
Playlist
Movie
Duration
Short (< 4 minutes)
Medium (4-20 minutes)
Long (> 20 minutes)
Sort by
Relevance
Rating
View count
Features
HD
Subtitles/CC
Creative Commons
3D
Live
4K
360°
VR180
HDR
573 results
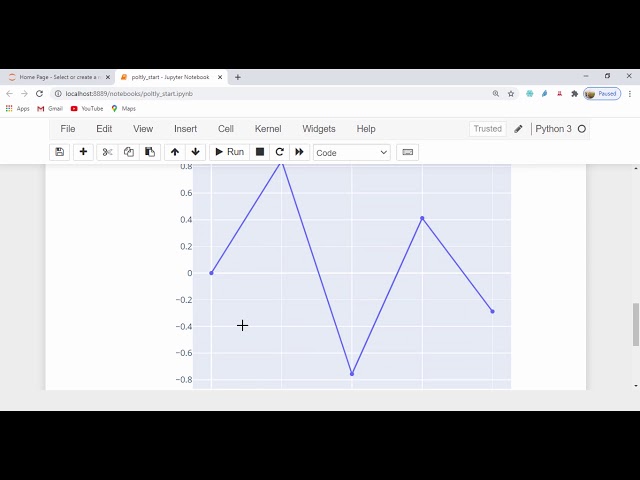
This course was designed to help you get started using Plotly. If you ever felt like your data visualization skills could use an ...
1,838 views
3 years ago
Explore the plotly interface for advanced and interactive plotting with Python and materials provided at ...
74 views
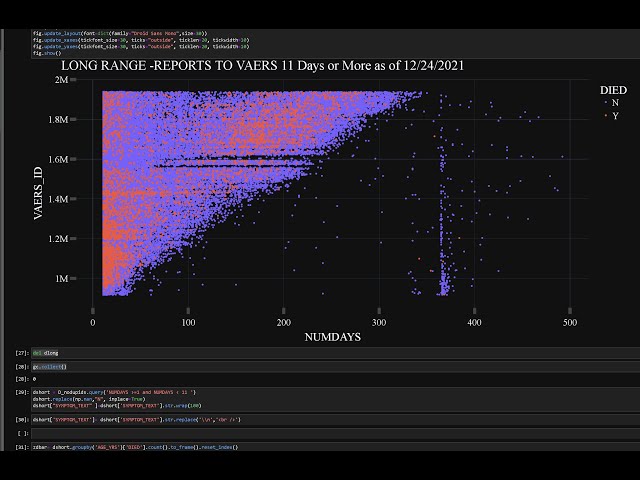
Highlights to focus on...Is Panda's text wrap, Replace Python new lines with HTML breaks, The Garbage Collect Module, and the ...
140 views
In this video, we'll dive into the exciting world of data visualization using Plotly in Python. You'll learn how to create an engaging ...
12 views
2 months ago
4,752 views
https://www.facebook.com/DataCapitalist/ https://twitter.com/data_capitalist https://www.linkedin.com/company/datacapitalist/
972 views
5 years ago
ai #python #codanics #artificialintelligence #urdu This complete course is being uploaded here: ...
949 views
2 years ago
3,125 views
hello, in this plotly beginner video, we get to quickly run through some common plots. (box plot, 3d scatter, area, polar, heat map, ...
279 views
Plotly is a powerful and interactive visualization library commonly used in data science for creating web-based visualizations that ...
58 views
1 year ago
hello there, in this video, we get to test run plotly. checkout my python for beginners course here: Learn Python From Scratch and ...
326 views
892 views
From R/Medicine Conference 2022 Jeremy John Selva, Research Assistant at National University of Singapore Background: In a ...
385 views
1,254 views
Montreal, November 11, 2013 -- Using Plotly and iPython for Scientific Graphing by Chris Parmer from Plotly. Source of the ...
33,904 views
12 years ago
hello, in this video, we test run plotly express. which is a high level interface wrapped around plotly. this means less code and ...
1,072 views
3,660 views
1,486 views
in this example video, we learn how to plot maps that visualize districts won. want to learn more about python programming, ...
3,137 views
hello, in this quick video, we will learn how to add simple colors to plots checkout my python beginner courses here Learn Python ...
656 views
![Plotly 101 - Graph Objects Intro & Figure Object - [Part 6/8]](/api/proxy/image?url=https%3A%2F%2Fi.ytimg.com%2Fvi%2FsrIU-QglaB0%2Fsddefault.jpg)


![Plotly 101 - Graph Objects, Adding Traces to Figures - [Part 7/8]](/api/proxy/image?url=https%3A%2F%2Fi.ytimg.com%2Fvi%2FNQHcs-rIoVk%2Fsddefault.jpg)


![Plotly 101 - Graph Objects Customization, Grids, Traces, Colors - [Part 8/8]](/api/proxy/image?url=https%3A%2F%2Fi.ytimg.com%2Fvi%2FOt-LUGVWwKk%2Fsddefault.jpg)


![Plotly 101 - Line Charts and How To Use Figure Reference - [Part 4/8]](/api/proxy/image?url=https%3A%2F%2Fi.ytimg.com%2Fvi%2Ff-W4Gr_TuXE%2Fsddefault.jpg)


![Plotly 101 - Introduction, Basics and Data Packages Tutorial - [Part 1/8]](/api/proxy/image?url=https%3A%2F%2Fi.ytimg.com%2Fvi%2Fasz-AqzajA8%2Fsddefault.jpg)
![Plotly 101 - Basic Customization and Facets - [Part 3/8]](/api/proxy/image?url=https%3A%2F%2Fi.ytimg.com%2Fvi%2F9I-zxm-vHNw%2Fsddefault.jpg)

