Upload date
All time
Last hour
Today
This week
This month
This year
Type
All
Video
Channel
Playlist
Movie
Duration
Short (< 4 minutes)
Medium (4-20 minutes)
Long (> 20 minutes)
Sort by
Relevance
Rating
View count
Features
HD
Subtitles/CC
Creative Commons
3D
Live
4K
360°
VR180
HDR
6,219 results
Video Description: Master Data Visualization with Python: From Beginner to Advanced! In this comprehensive Data ...
33,195 views
11 months ago
... https://coursera.pxf.io/AoYOdR Tableau Data Visualization - https://coursera.pxf.io/MXYqaN Udemy Courses: Python for Data ...
105,580 views
1 year ago
Take my Full Python Course Here: https://www.analystbuilder.com/courses/pandas-for-data-analysis In this series we will be ...
221,459 views
2 years ago
505,502 views
"The Python Data Visualization Landscape in 2020 EuroPython 2020 - Talk - 2020-07-24 - Parrot Data Science Online By Bence ...
926 views
5 years ago
In our research, hospitals, businesses and work, we accumulate new data every second. Indeed, data is everywhere.
1,012 views
Streamed 5 years ago
Try CodeCrafters for free using my referral link: https://app.codecrafters.io/join?via=trentpark8800 In this walkthrough, we dive into ...
84,085 views
Britta Westner takes us on a journey through the world of data visualization possibilities with MNE-Python on March 25th 2021.
279 views
4 years ago
Data Visualization with Python. Learn Matplotlib, Numpy, line plot, bar plot, scatter plot, histogram, data set, and distribution ...
37 views
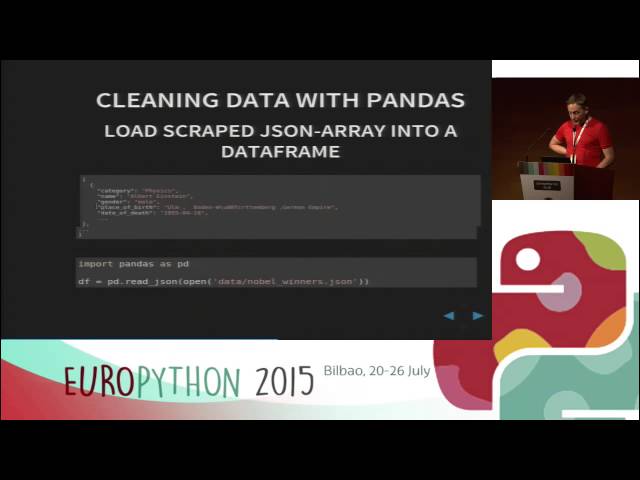
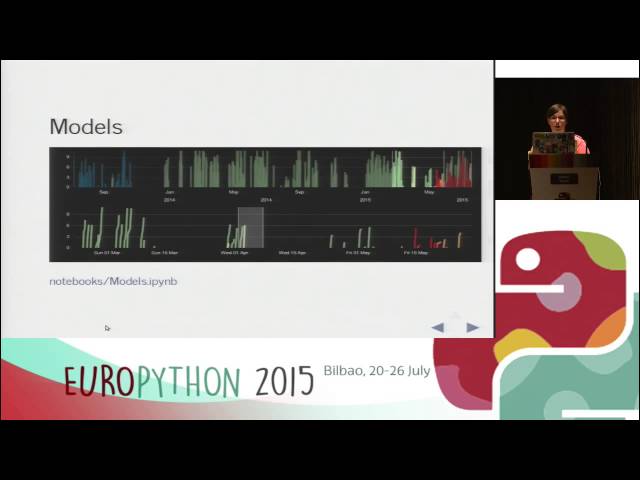
Kyran Dale - Data-visualisation with Python and Javascript: crafting a data-viz toolchain for the web [EuroPython 2015] [21 July ...
3,060 views
10 years ago
This tutorial teaches how to use the Plotly library in Python to perform Data visualizations. Recording and Tutorial was made by ...
701 views
Generating figures is part of the scientific process. This should not be manual, but ideally they should be automatically generated ...
778 views
In this tutorial, you'll learn about how to Data Visualization by using Plotly. Plotly is the best tool in Python for Data Visualization.
147 views
3 years ago
Take my Full Python Course Here: https://bit.ly/48O581R In this series, we will be walking through everything you need to know to ...
203,669 views
Stephan Heunis about how to visualize your data interactively and how to deploy a Dash app to let others interact with your data ...
121 views
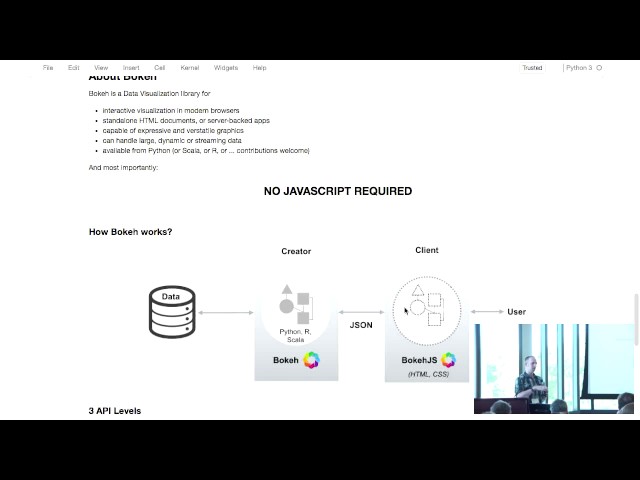
Steven C. Howell http://pyohio.org/schedule/presentation/288/ Bokeh is a powerful library for creating interactive data ...
6,963 views
8 years ago
Debugging Your Code with Data Visualization [EuroPython 2018 - Talk - 2018-07-26 - Fintry [PyData]] [Edinburgh, UK] By James ...
855 views
7 years ago
... we have uh hafton he's going to talk about geospatial data analysis and visualization in Python let's give him a warm welcome.
19,698 views
Streamed 8 years ago
http://blog.muyueh.com/real-time-visualization-with-python-and-d3-js/ Pyhton has great power in scrapping and analyzing data, ...
22,313 views
11 years ago
If you have some computer science knowledge, but never worked with Python before, this is the right place for you. Our speaker ...
1,393 views
Today we continue our Data Analyst Portfolio Project Series. In this project we will be working in Python to find correlations ...
211,137 views
In this tutorial, you'll learn how to data visualization using Python and master the Python Programming Language! Seaborn ...
59 views
In this course you will learn how to visualize data with python matplotlib library. #Matplotlib is very powerful python library that can ...
9 views
This tutorial will teach you hands-on practice on generating visualizations in Python with Matplotlib and also intuitively use. Data ...
47 views
Sarah Bird - Getting started with Bokeh / Let's build an interactive data visualization for the web..in Python! [EuroPython 2015] [20 ...
11,222 views