Upload date
All time
Last hour
Today
This week
This month
This year
Type
All
Video
Channel
Playlist
Movie
Duration
Short (< 4 minutes)
Medium (4-20 minutes)
Long (> 20 minutes)
Sort by
Relevance
Rating
View count
Features
HD
Subtitles/CC
Creative Commons
3D
Live
4K
360°
VR180
HDR
75,563 results
Colab Notebook: https://colab.research.google.com/drive/1wxI23X7EzV2-DlWU7F0iIeTSTV2OPYTy?usp=sharing Thank you for ...
35,423 views
3 years ago
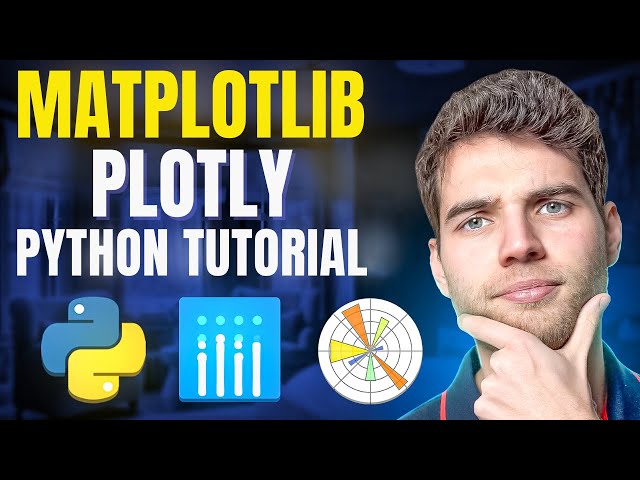
Unlock the full potential of Python for data visualization in just 1.5 hours with this comprehensive Plotly tutorial. Perfect for ...
9,685 views
2 years ago
An introduction to the Dash web application framework. Dash is used to create browser-based interactive data visualization ...
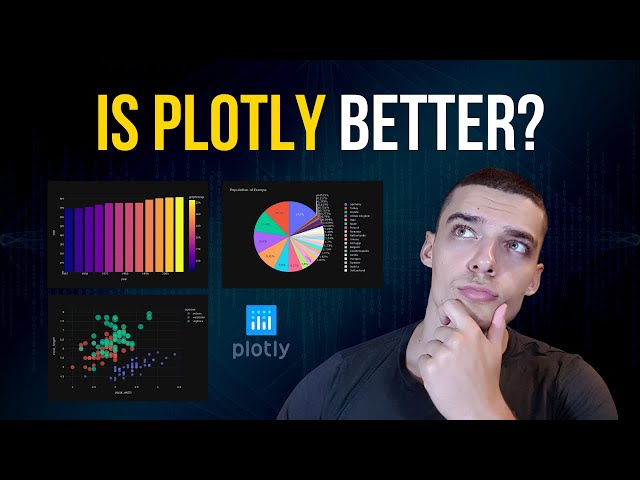
852,078 views
5 years ago
In this video we take a quick look at the Plotly framework in Python. At the end we compare it to Matplotlib.
104,518 views
4 years ago
New Data Science / Machine Learning Video Everyday at 1 PM EST!!! [ Click Notification Bell ] This video provides complete ...
261,227 views
In this video Rob, a Kaggle Grandmaster, quickly and humorously walks through each of the popular plotting and data ...
106,445 views
Learn the quickest way to build a Python Dashboard with ChatGPT Plotly and Dash. We'll show you two separate dashboards, ...
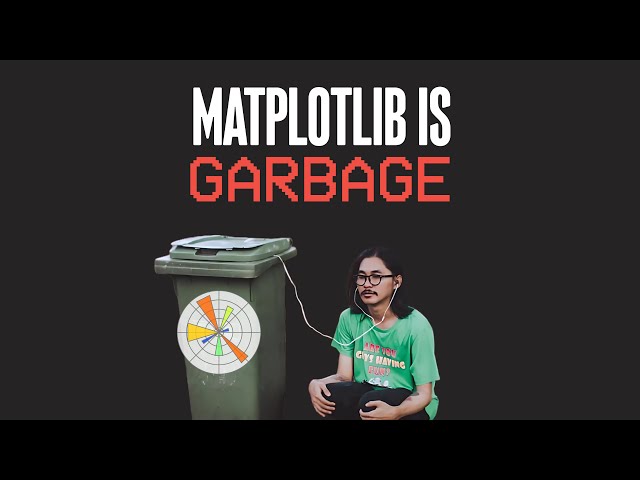
74,470 views
Tired of Matplotlib's outdated approach? Discover these 5 powerful Python libraries that offer cleaner, more intuitive, and often ...
7,027 views
1 year ago
Explore All My Excel Solutions: https://pythonandvba.com/solutions DESCRIPTION ...
8,741 views
Unleash the power of data with our quick rundown of the "Top 3 Python Libraries for Stunning Data Visuals!" ✨ In this video, we ...
608 views
6 months ago
In this video, I cover the top 2 Python libraries for data visualisation: Matplotlib and Plotly. Matplotlib is the most well-known and ...
728 views
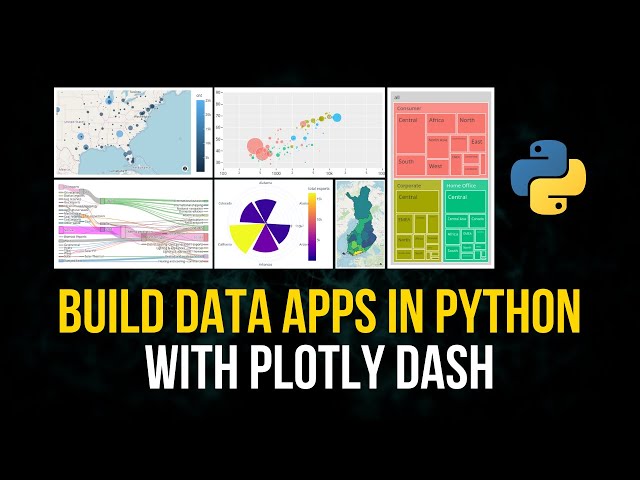
Learn to build Python data apps and data visualizations with Dash by Plotly. This is a detailed overview of Dash as well as a demo ...
30,779 views
In this video, we learn how to easily build data applications in Python with Plotly Dash. Dash Examples: ...
17,880 views
Data visualization is an import part of working with data and Python has many libraries that allow you to display a wide range of ...
7,959 views
Matplotlib vs Seaborn vs Plotly: Best Python Visualization Tools.
2,145 views
1 month ago
ai #python #codanics #artificialintelligence #urdu This complete course is being uploaded here: ...
1,619 views
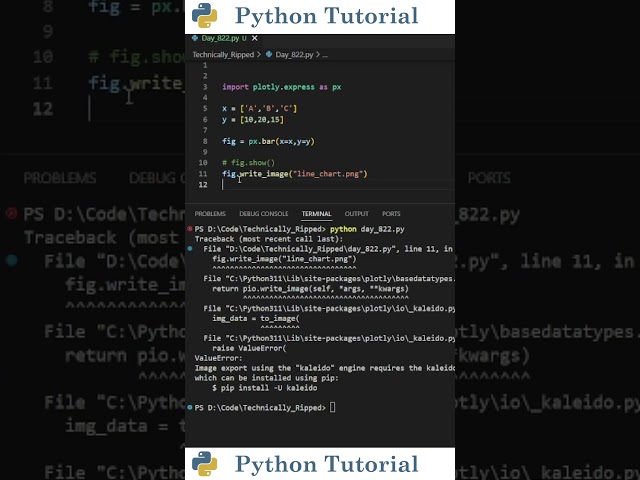
Learn two easy ways to save your Plotly charts as image files in Python! Use write_image() with the Kaleido library, or take a ...
5,796 views
3 months ago
Ever wonder the difference between Plotly Express and Graph Objects? Learn all about Plotly and how to navigate its ...
84,829 views
ai #python #codanics #artificialintelligence #urdu We will cover this: https://codanics.com/data-visualization-in-data-science/ This ...
6,242 views
Streamed 2 years ago
Join my Python Masterclass - https://www.zerotoknowing.com/join-now Join my Python Newsletter ...
9,554 views
Get your Free Python Starter Course ~ https://tinyurl.com/2kjh4n4r Join 9k+ Readers — Python Newsletter ...
22,239 views
Data visualization is an important part of working with data and Python has many libraries that allow you to display a wide range of ...
11,354 views
Learn how to create insightful and interactive box plots using Python and Plotly! With these simple steps, you can visualize your ...
507 views
Plotly produces interactive graphs, that can be embedded on websites, and provides a wide variety of complex plotting options.
7,301 views
Learn how to integrate Plotly with Python's most popular web framework Django and create amazing interactive charts in your ...
29,795 views